Check for Bugs and Run-Time Errors in C/C++ Tests and Functions Under Test
In a typical test authoring workflow, you write a test that calls one or more functions, build the test, and finally run the test for a pass or fail status. If one of the functions under test causes run-time errors such as overflows or access out of bounds, your test results might be unreliable or you might see sporadic test failures. To avoid these issues, you can preemptively check the tested functions for run-time errors with respect to the test inputs.
For C/C++ tests authored using the Polyspace® Test™ xUnit-based API, you can also check the tests for possibly incorrect API usage.
Why Check Tests for Bugs and Run-time Errors
You check for bugs and run-time errors in the tests and functions under test to increase the overall reliability of your tests.
Code Prover
You can run Code Prover on a test and function under test to statically prove the absence of specific run-time errors during test execution.
Consider this simple function that returns twice its argument:
int times_two(int x) {
    return 2*x;
}INT_MAX. The test written using the Polyspace
Test xUnit-based API might look like this:#include <limits.h>
#include <pstunit.h>
int times_two(int);
int param_comb1_val[] = {INT_MAX, 10, 1};
PST_PARAM_WITH_VALUES (param_comb1, int, pst_format_param_int, param_comb1_val,3);
PST_SUITE(arith_operations_suite);
PST_TEST_CONFIG(arith_operations_suite, test_times_two) {
PST_ADD_PARAM(param_comb1);
}
PST_TEST_BODY(arith_operations_suite, test_times_two) {
int p1 = *PST_PARAM_PTR(param_comb1);
int p1_times_two = times_two(p1);
PST_ASSERT(p1_times_two - p1 == p1);
}
PST_REGFCN(registerTest) {
PST_ADD_TEST(arith_operations_suite, test_times_two);
}
#ifndef PSTEST_BUILD
int main(int argc, char* argv []) {
PST_REGFCN_CALL(registerTest);
return PST_MAIN(argc, argv);
}
#endifparam_comb1 that iterates through an array of three values, the first being INT_MAX. The test configuration sets up this parameter and the test body uses the parameter to invoke the function times_two (see also Write Parameterized Tests for C/C++ Functions Using Polyspace Test xUnit API). For the parameter value
INT_MAX, the multiplication overflows and the function returns an undefined value. Even if the test passes initially, you might see a sporadic failure later because of the overflow.To detect issues like this, you can run Polyspace
Code Prover™ on the parameterized test. The Code Prover analysis checks the function times_two for run-time errors for all values of the test parameter and detects the overflow when the test parameter has the value INT_MAX.
Code Prover analysis of tests differ in scope from a full Code Prover analysis of source code. For more information, see Difference Between Code Prover Analysis of Tests and Full Code Prover Analysis.
Bug Finder
You can run Bug Finder on a test and function under test to find errors that might occur during test execution. Some of the errors can appear as compilation failures, while others can lead to run-time errors or incorrect test results.
In particular, for tests authored using the Polyspace Test xUnit-based API, Bug Finder can check for possibly incorrect usage of the C/C++ xUnit API. While some of the errors can also appear as compilation failures, the compiler error messages might refer to details of the xUnit API macros and might be difficult to debug. Instead, Bug Finder can highlight the incorrect API usage at the point where the macros are used. See also Libraries Misuse Defects (Polyspace Bug Finder).
Check for Run-time Errors After Building Tests
After authoring tests, first build your tests to fix all compilation errors. You can then check the functions to test for run-time errors, before running the tests. Alternatively, to diagnose sporadic test failures after running tests, you can check for run-time errors in the previously tested function(s).
Example Files
This tutorial uses the files in the folder polyspaceroot\polyspace\examples\doc_pstest\running_code_prover_on_testspolyspacerootC:\Program Files\Polyspace\R2026a. To continue with this tutorial:
Create a new Polyspace Platform project.
On the toolstrip, select
 and add the
 srcsubfolder to the project.This folder contains the source code with the
times_two()function defined earlier.On the toolstrip, select Import Tests > Add Polyspace xUnit Test Folder and add the
testssubfolder to the project.This folder contains the test code with the
arith_operations_suitetest suite defined earlier.
Run Static Analysis on Tests
Run a Code Prover analysis on the xUnit tests in the file test.c.
User Interface. To run Code Prover on tests in the Polyspace Platform user interface:
On the Projects pane, right-click the Tests Source node of the project below xUnit Tests and select Prove Absence of RTEs in Test.
If you want to run Bug Finder, select Find Issues in Test instead.
Follow the progress of analysis on the Polyspace | RTE log window.
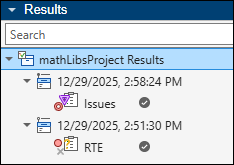
After analysis, on the Results pane, you see an RTE node for the Code Prover results (or Issues node if you ran Bug Finder). Right-click this node and select Open Review to open the full list of static analysis results.
The analysis of tests uses the same options as a regular Bug Finder or Code Prover analysis. For instance, if you run Bug Finder on a test, the analysis uses the checkers that you specified on the Static Analysis tab of your project configuration.
Command Line. Run one of the commands, polyspace-bug-finder or polyspace-code-prover, on the source and test files.
For instance, at the command line, you can run Code Prover using the following command:
polyspace-code-prover -sources example.c,test.c -library pstunit -I "<polyspacroot>\polyspace\pstest\pstunit\include"example.c with respect to the test inputs specified in the file test.c. Here, <polyspacroot> is the Polyspace installation folder, for instance, C:\Program Files\Polyspace\R2026a.Analysis options such as -I and -library are used to provide the Polyspace
Test API declarations and narrow the scope of analysis to test inputs only. For more information, see:
polyspace-bug-finder(Polyspace Bug Finder) orpolyspace-code-prover(Polyspace Code Prover)Include paths (-I)(Polyspace Code Prover)Libraries used (-library)(Polyspace Code Prover)
The preceding command analyzes the functions under test with respect to all tests. To analyze the functions with respect to specific tests, use the option -pstunit-test (Polyspace Bug Finder). For instance, to analyze with respect to the test myTest in a test suite mySuite, add the analysis
option:
-pstunit-test mySuite/myTest
Review Analysis Results and Fix Issues
After analysis, the results are stored in a .pscp file (or .psbf file if you ran Bug Finder):
If you run the analysis in the Polyspace Platform user interface, the results appear on the Results pane. Right-click the RTE node (or Issues node if you ran Bug Finder) and select Open Review to open the results.
If you run the analysis at the command-line, you can open the resulting
.pscp(or.psbf) file in the Polyspace Platform user interface using the Open button on the toolstrip, or upload to Polyspace Access™ for review in a web browser.
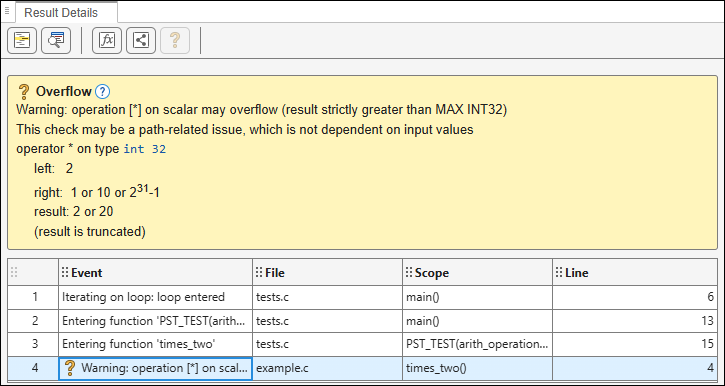
If you open the Code Prover results, the Results List pane shows an orange Overflow check in the file example.c. If you select this result:
On the Result Details pane, you see that the overflow results from a multiplication operation resulting in a value greater than
MAX INT32. Below the error message, you can see the values of the left and right operands of the multiplication.You can also see a sequence of events starting from the test to the function under test that causes the overflow.
On the Source Code pane, you see the line causing the overflow:
If you hover on thereturn 2*x;*operation, a tooltip appears, showing the operand values that cause the overflow. You can see that the operandxtakes one of three values, 1, 10, orINT_MAX, with the valueINT_MAXcausing the overflow.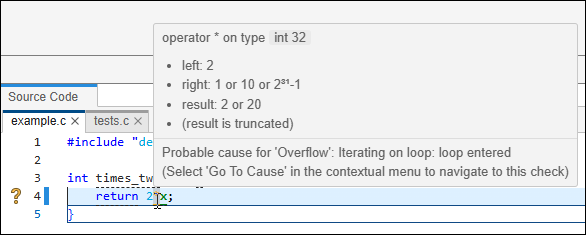
To fix the issue, do one of the following:
Update the function under test,
times_two, to avoid the overflow.Update the test to remove the parameter value
INT_MAX, if your function under test is not meant to handle this input value.
See Also
polyspace-bug-finder (Polyspace Bug Finder) | polyspace-code-prover (Polyspace Code Prover) | Libraries used (-library) (Polyspace Code Prover) | -pstunit-test (Polyspace Bug Finder)