Control Code Partitions for MATLAB Functions in Stateflow Charts
Simulink® PLC Coder™ inlines MATLAB® functions in generated code based on your inlining specifications. To specify whether to inline a function:
Right-click the MATLAB function and select Properties.
For Function Inline Option, select
Inlineif you want the function to be inlined. SelectFunctionif you do not want the function to be inlined. For more information, see Specify Properties of MATLAB Functions (Stateflow).
However, Simulink PLC Coder does not follow your inlining specifications exactly in the following cases:
If a MATLAB function accesses data that is local to the chart, it is inlined in generated code even if you specify that the function must not be inlined.
Explanation: The chart is converted to a function block in generated code. If the MATLAB function in the chart is converted to a Structured Text function, it cannot access the data of an instance of the function block. Therefore, the MATLAB function cannot be converted to a Structured Text function in generated code and is inlined.
If a MATLAB function has multiple outputs and you specify that the function must not be inlined, it is converted to a function block in generated code.
Explanation: A Structured Text function cannot have multiple outputs, therefore the MATLAB function cannot be converted to a Structured Text function.
The following simple example illustrates the different cases.
The model used here has a Stateflow® chart that contains four MATLAB functions fcn1 to fcn4.
Here is the model.
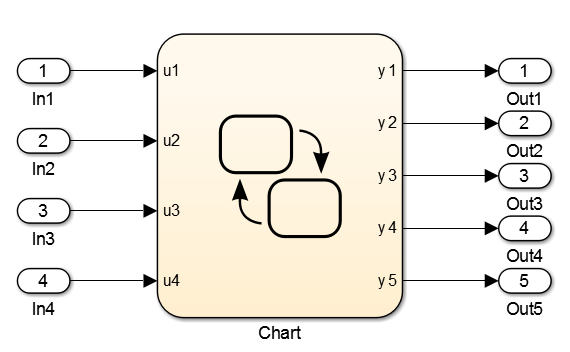
Here is the Stateflow chart.

The functions fcn1 to fcn4 are
defined as follows.
| Function | Inlining Specification | Generated Code |
|---|---|---|
|
function y = fcn1(u) y = u+1; | Specify that the function must be inlined. |
is_c3_Chart := Chart_IN_A; (* Outport: '<Root>/y1' incorporates: * Inport: '<Root>/u1' *) (* Entry 'A': '<S1>:10' *) (* MATLAB Function 'fcn1': '<S1>:1' *) (* '<S1>:1:3' *) y1 := u1 + 1.0; |
|
function y = fcn2(u) y = u+2; | Specify that the function must not be inlined. |
is_c3_Chart := Chart_IN_B;
(* Outport: '<Root>/y2' incorporates:
 *  Inport: '<Root>/u2' *)
(* Entry 'B': '<S1>:11' *)
 y2 := fcn2(u := u2);
.
.
.
FUNCTION fcn2: LREAL
VAR_INPUT
    u: LREAL;
END_VAR
VAR_TEMP
END_VAR
(* MATLAB Function 'fcn2': '<S1>:4' *)
(* '<S1>:4:3' *)
fcn2 := u + 2.0;
END_FUNCTION |
|
function y = fcn3(u) % The function accesses % local data x of parent chart y = u+3+x; | Specify that the function must not be inlined. |
is_c3_Chart := Chart_IN_C; (* Outport: '<Root>/y3' incorporates: * Inport: '<Root>/u3' *) (* Entry 'C': '<S1>:15' *) (* MATLAB Function 'fcn3': '<S1>:9' *) (* The function accesses local data x of parent chart *) (* '<S1>:9:4' *) y3 := (u3 + 3.0) + x; |
|
function [yy1,yy2] = fcn4(u) yy1 = u+4; yy2 = u+5; | Specify that the function must not be inlined. |
is_c3_Chart := Chart_IN_D;
(* Entry 'D': '<S1>:28' *)
i0_fcn4(u := u4);
b_y4 := i0_fcn4.yy1;
b_y5 := i0_fcn4.yy2;
(* Outport: '<Root>/y4' incorporates:
 *  Inport: '<Root>/u4' *)
y4 := b_y4;
(* Outport: '<Root>/y5' *)
y5 := b_y5;
.
.
.
FUNCTION_BLOCK fcn4
VAR_INPUT
    u: LREAL;
END_VAR
VAR_OUTPUT
    yy1: LREAL;
    yy2: LREAL;
END_VAR
VAR
END_VAR
VAR_TEMP
END_VAR
(* MATLAB Function 'fcn4': '<S1>:26' *)
(* '<S1>:26:3' *)
yy1 := u + 4.0;
(* '<S1>:26:4' *)
yy2 := u + 5.0;
END_FUNCTION_BLOCK |