可視化
RTI 表示および DTI 表示を使用してデータを可視化する
Phased Array System Toolbox™ を使用すると、RTI、DTI、およびその他の時間依存データをグラフィカルに表示できます。
オブジェクト
phased.ATIScope | View angle-time array response (R2022b 以降) |
phased.AngleDopplerScope | Angle-Doppler scope |
phased.DTIScope | Doppler-time intensity scope |
phased.IntensityScope | Range-time-intensity (RTI) or Doppler-time-intensity (DTI) display |
phased.RangeAngleScope | View range-angle response |
phased.RangeDopplerScope | Range-Doppler scope |
phased.RTIScope | Range intensity scope |
ブロック
| Angle-Time Intensity Scope | Angle-time intensity scope (R2022b 以降) |
| Doppler-Time Intensity Scope | Doppler-time intensity scope (R2022a 以降) |
| Range-Time Intensity Scope | Range-time intensity scope (R2022a 以降) |
トピック
- Measure Intensity Levels Using the Intensity Scope
This tutorial shows you how to measure the intensity of signals using the UI of the intensity scope.
注目の例
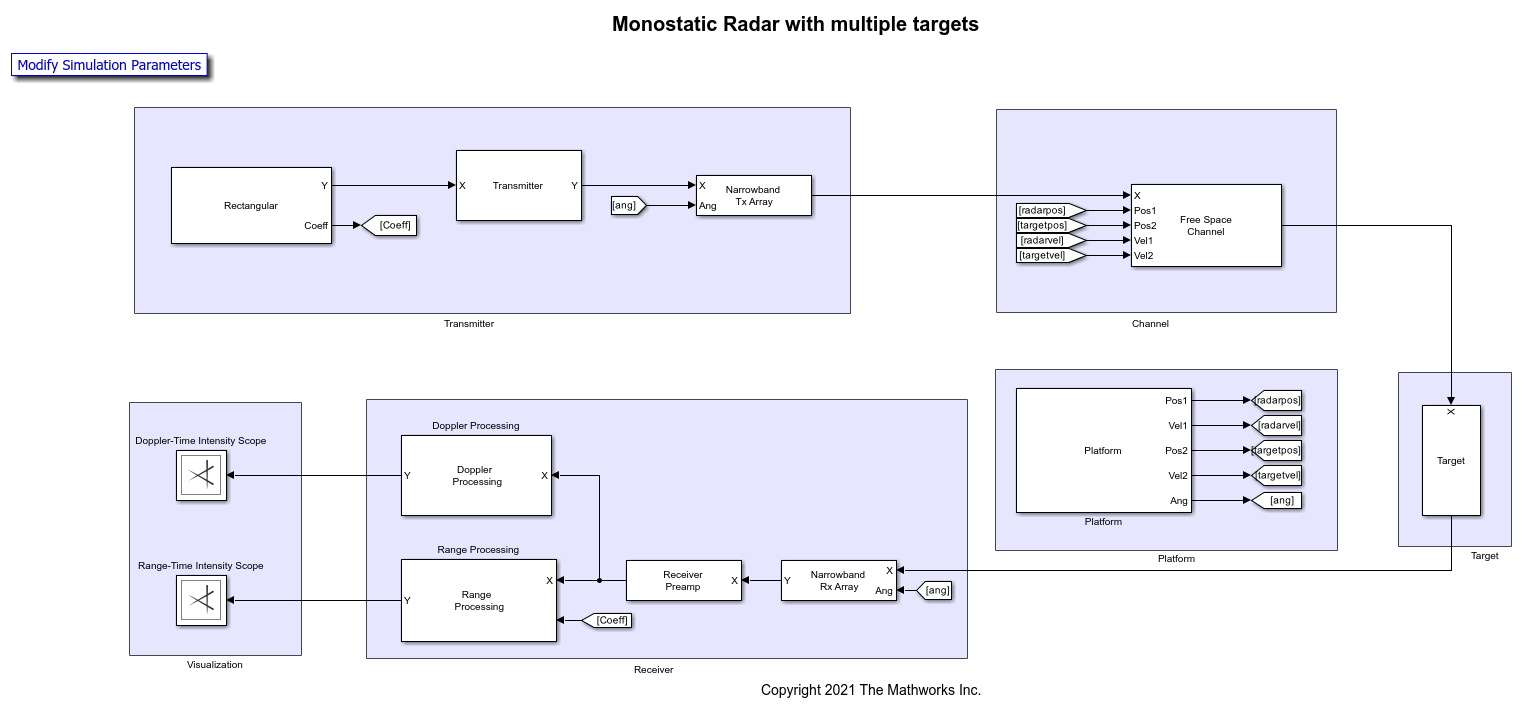
Simulate and Visualize Range and Doppler Intensity Data in an End-to-End Radar System
Model an end-to-end radar system and use the scopes to visualize range-intensity and Doppler-intensity data in Simulink.