Generate VerilogA Model of CTLE Using Custom Function
This example shows you how to write a custom analysis function to fit the transfer function of a CTLE circuit to a rational function in the Mixed Signal Analyzer app and generate a VerilogA model that can be simulated in Cadence.
CTLE
Continuous Time Linear Equalizer (CTLE) is used in Serializer/Deserializer (SerDes) systems for signal reconstruction. It applies a linear peaking filter to equalize the signal and reduce distortions resulting from lossy channels.
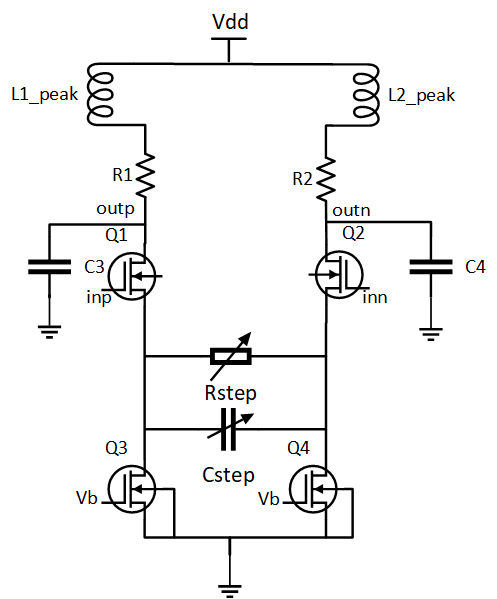
Using the notations used in a typical CTLE circuit, the transfer functiont of the CTLE is:
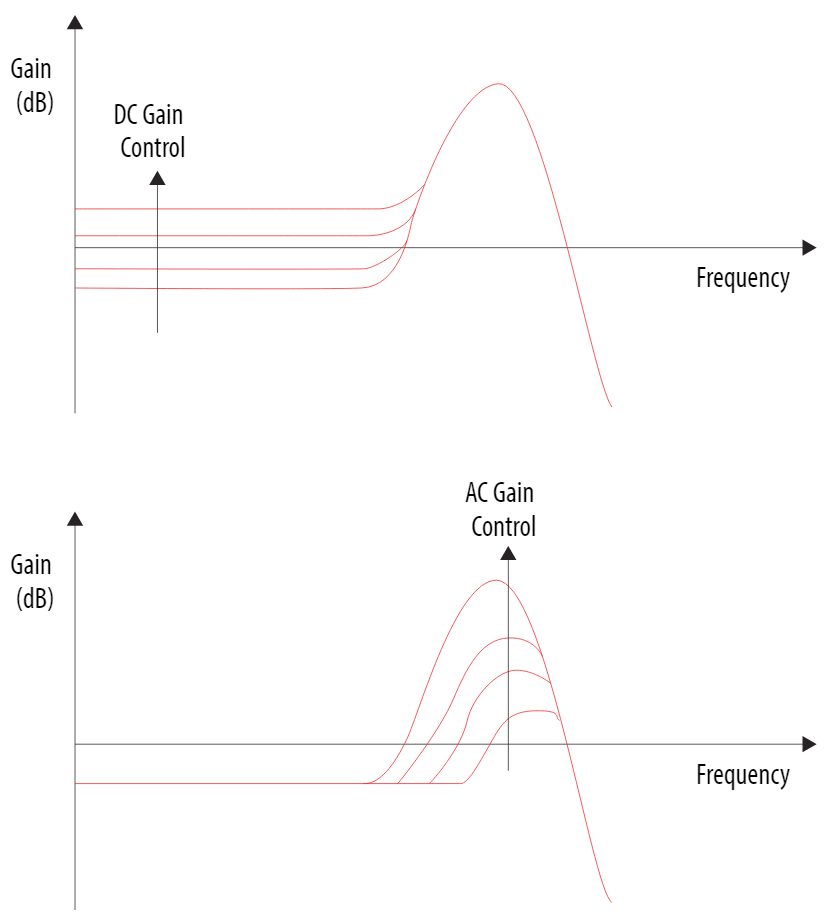
The equalization circuits compensate for low-pass characteristics of the physical medium by amplifying high-frequency components of the incoming signal. The CTLE can support both DC and AC gain [1]. In this example, the DC gain control is varied in the CTLE circuit by varying Rstep.
Custom Analysis in Mixed Signal Analyzer
To generate CTLE simulation data using Cadence Virtuoso, simulate the CTLE using different gain settings and save the input and output waveforms for each setting. To extract the Cadence simulation data into a mat file for further analysis in the Mixed Signal Analyzer app, use the function Mixed-Signal Analyzer.
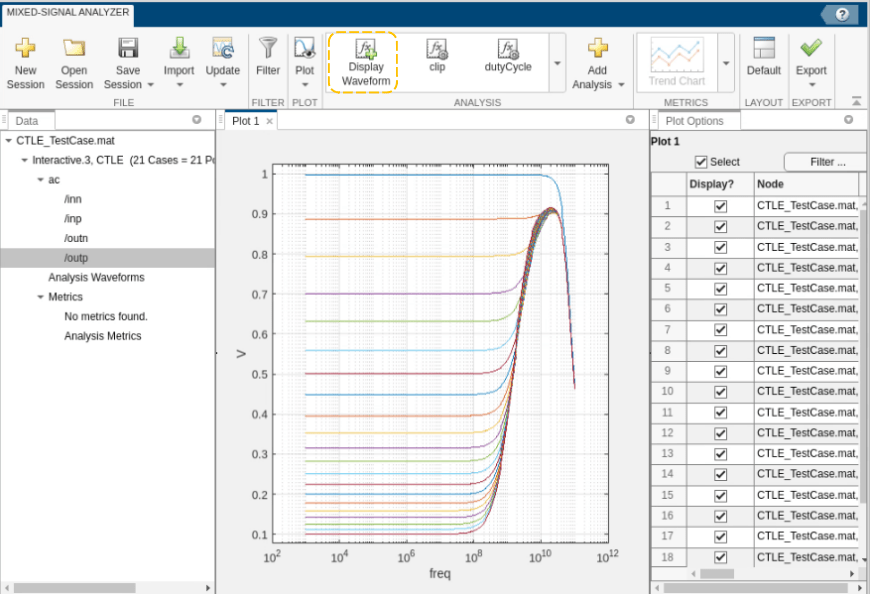
The CTLE simulation data used in this example is provided in a mat file named CTLE_TestCase.mat. You can import the simulation data in the app using the command:
mixedSignalAnalyzer('CTLE_TestCase.mat')
This launches the app and displays the list of waveform data brought over from Cadence in the Data panel. Next, you can select any signal name and click the Display Waveform button in the toolstrip to visualize the signal. This image displays the waveforms related to 21-point sweeps for signal outp in the plot.
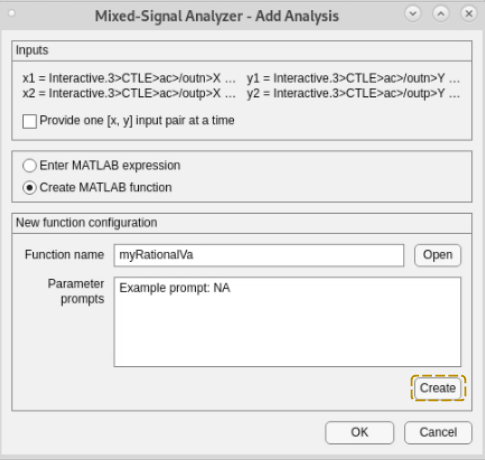
To add a custom analysis function to fit the CTLE transfer function to a rational function, select the signals /outp and /outn and then click the Add Analysis button in the app toolstrip. This launches the Add Analysis dialog box. Select Create MATLAB function option and click the Create button to open MATLAB® script to code your algorithm.
Add your custom code after the Begin custom code comment in the MATLAB script.
For example, the algorithm for the custom function to perform rational fit is:
Define the arguments which are the waveforms from AC analysis.
The differential output is given by the equation
y2–y1. Here y2 equalsoutpandy1equalsoutn.x1is the frequency vector. The differential input to CTLE has a unity magnitude.Perform rational fitting of the frequency domain response and obtain the response
Yout.Export the obtained rational function to a VerilogA file for behavioral model simulation in Cadence [2].
This code implements the algorithm to perform the rational fit.
function [Xout, Yout, NameValuePairs] = myRationalVa(x1, x2, y1, y2, dialogAnswers)
%MYRATIONAL Summary of this function goes here
%   Detailed explanation goes here
%
%   Inputs:
%       x1, ..., xN         x-coordinate vectors for waveforms 1 through N
%       y1, ..., yN         y-coordinate vectors for waveforms 1 through N
%       dialogAnswers       struct containing responses to the parameter
%                           dialog box.
%   Outputs:
%       Xout                x-coordinate vector for output waveform
%       Yout                y-coordinate vector for output waveform
%       NameValuePairs      cell array. Even entries are names (text) and
%                           odd entries are values (any type). By default,
%                           the following names have special meanings:
%                               xUnit   'Time' | 'Freq' units for Xout
%                               yUnit   'Time' | 'Freq' units for Yout
%                               xScale  'Linear' | 'Log' scaling for Xout
%                               yScale  'Linear' | 'Log' scaling for Yout
%                               xLabel  Xout axis label (text)
%                               yLabel  Yout axis label (text)
%                               function Name of the completed analysis
%                           All other name-value pairs are interperted as
%                           analysis metrics.

% Comments following dialogAnswers are used as prompts for the input dialog
% box. Modifying these comments will change the prompts.
arguments
    x1 {mustBeNumeric, mustBeVector};
    x2 {mustBeNumeric, mustBeVector};
    y1 {mustBeNumeric, mustBeVector};
    y2 {mustBeNumeric, mustBeVector};
    dialogAnswers.Prompt1 {mustBeNonzeroLengthText} = '0'; % Example prompt: NA
end

%Initialize returned values
Xout = x1;
% Yout = y1;
NameValuePairs = {};

% Begin custom code.
persistent n;
if isempty(n)
    n = 1;
end
rationalObject = rational(x1,y2-y1);
Yout = freqresp(rationalObject,x1);
writeva(rationalObject,['file' num2str(n)]);
n = n+1;
semilogx(x1, 20*log10(abs(Yout)));
hold on; semilogx(x1, 20*log10(abs(y2-y1)));
end
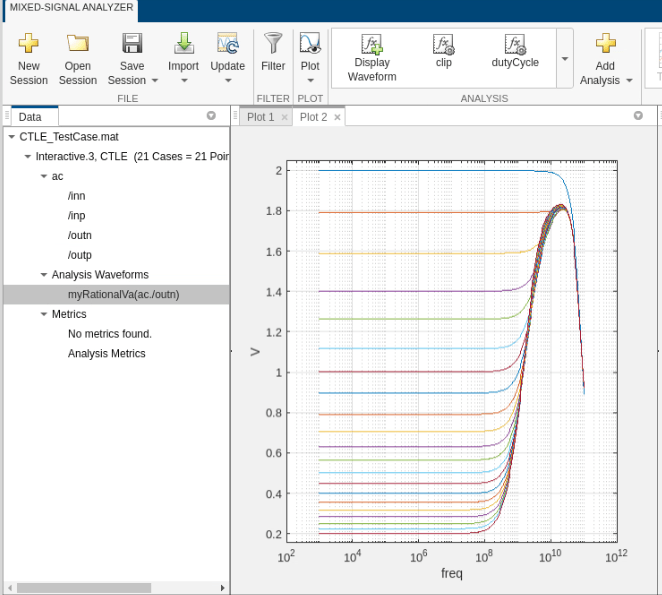
Save your custom analysis function. The waveform myRationalVa appears under the Analysis Waveforms option in the Data panel. To display the waveforms, click the Plot button to add a new tabbed plot window. Then select myRationalVa and click the Display Waveform button.
Verification In Cadence
This custom function also generates 21 VerilogA files corresponding to the 21 cases in the simulation database. You can use the VerilogA models for behavioral simulations in Cadence or to share a blackbox model of your design without disclosing your IP. A comparison of simulation result in Cadence Virtuoso, using the CTLE schematic (transistor-level) versus the generated VerilogA model shows a close match between the two cases, for Rstep = 1.515 kOhm.

References
[1] Continuous Time Linear Equalization (CTLE) (intel.com)
[2] Export Verilog-A Model - MATLAB & Simulink (mathworks.com)