Fill Lookup Tables from Data
Setting Up a Lookup Table and Experimental Data
If you are considering a straightforward strategy, you might want to fill lookup tables directly from experimental data. For example, a simple torque strategy fills a lookup table with values of torque over a range of speed and relative air charge, or load. You can use CAGE to fill this strategy (which is a set of lookup tables) by referring to a set of experimental data. You can also fill lookup tables with the output of optimizations.
This tutorial takes you through the steps of calibrating a lookup table for torque, based on experimental data.
Start CAGE by typing
cage
First, set up a blank lookup table ready for filling using experimental data or optimization output.
Add the variables for speed and load by importing a variable dictionary.
Add a new table to your session.
Add Variables
Before you can add lookup tables to your session, you must add variables to associate with the normalizers or axes.
To add a variable dictionary,
Select File > Import > Variable Dictionary.
Select
table_filling_tutorial.xmlfrom thematlab\toolbox\mbc\mbctrainingfolder.
This loads a variable dictionary into your session. The variable dictionary includes:
N, the engine speedL, the relative air chargeA, the air/fuel ratio (AFR)stoich, the stoichiometric constant
You can now add a lookup table to your session.
Add a New Lookup Table
First, add a lookup table to fill.
Select File > New > 2D Lookup Table.
This opens a dialog box that asks you to specify the variable names for the normalizers. As you can see in the dialog box controls, accepting the defaults creates a lookup table with 10 rows and 10 columns with an initial value of
0in each cell.Change the number of columns to
7.Select
Las the variable for normalizer Y andNas the variable for normalizer X, then click OK.
CAGE takes you to the Lookup Tables view.
CAGE has automatically initialized the normalizers by spacing the breakpoints evenly across the range of values for the engine speed (N) and load (L). The variable ranges are found in the variable dictionary. Switch to the Normalizer view to inspect the normalizers.
Expand the lookup table branch by t NNormalizer as
shown.
This displays the two normalizers for the lookup table.
You have an empty lookup table with breakpoints over the ranges of the engine speed and load, which you can fill with values based on experimental data.
Import Experimental Data
To fill a lookup table with values based on experimental data, you must add
the data to your session. If you want to fill a lookup table with the output of
an optimization, the output appears automatically in the Data Sets view as a new
data set called Exported_Optimization_Data when you select
the Export to Data Set toolbar button. For this tutorial, you need some
experimental data.
CAGE uses the Data Sets view to store grids of data. Thus, add a data set to your session.
Select File > New > Data Set to add a data set to your session. This changes the view to the Data Set view.
You can now import experimental data into the data set:
Select File > Import > Data.
In the file browser, select
meas_tq_data.csvfrom thematlab\toolbox\mbc\mbctrainingfolder and click Open.This set of data includes six columns of data: the test cell settings for engine speed (
RPM), and the measured values of torque (tqmeas), engine speed (nmeas), air/fuel ratio (afrmeas), spark angle (spkmeas), and load (loadmeas).This opens the Data Set Import Wizard. The first screen asks which of the columns of data you want to import. Click Next to import them all.
The following screen asks you to associate variables in your project with data columns in the data.
Highlight
Nin the Project Assignments column andnmeasin the Data Column, then click the assign button, shown.
Repeat this to associate
Lwithloadmeas. The dialog box should be the same as the following.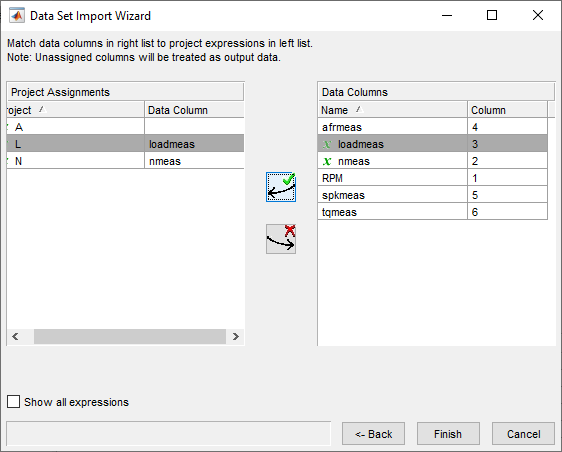
Click Finish to close the dialog box.
You now have an empty lookup table and some experimental data in your session. You are ready to fill the lookup table with values based on this data.
Fill Lookup Table from Experimental Data
You have an empty lookup table and the experimental data in your session. You can now fill the lookup table with values based on your data.
The data that you have imported is a series of measured values of torque at a selection of different operating points. These operating points do not correspond to the values of the breakpoints that you have specified. The lookup table has a range of engine speed from 500 revolutions per minute (rpm) to 3500 rpm. The range of the experimental data is far greater.
CAGE extrapolates the values of the experimental data over the range of your lookup table. Then it fills the lookup table by selecting the torque values of the extrapolation at your breakpoints.
To fill the lookup table with values based on the experimental data,
To view the Lookup Table Filler display, click
 in the toolbar in the Data Sets
view; or select View > Lookup Table Filler.
in the toolbar in the Data Sets
view; or select View > Lookup Table Filler.You can use this display to specify the lookup table you want to fill and the factor you want to use to fill it.
In the lower pane, select
New_2D_Tablefrom the Lookup table to fill list.Select
tqmeasfrom the Factor to fill lookup table list. This is the data that you want to use to fill the lookup table.Select
Nfrom the X-axis factor list andLfrom the Y-axis factor list. Your session should be similar to this.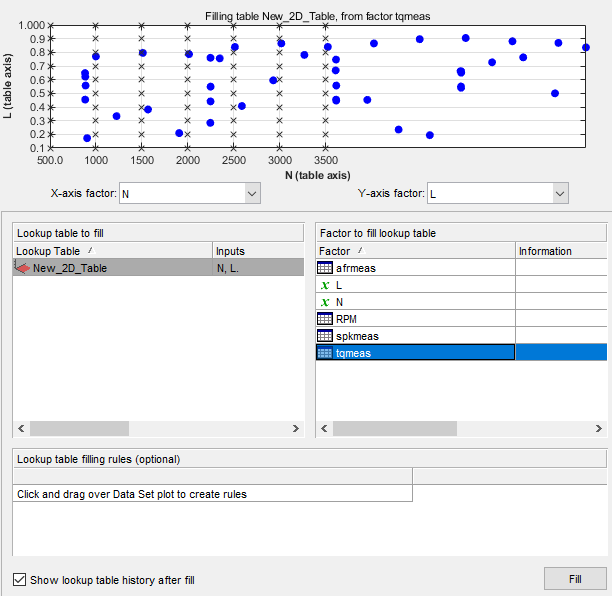
The upper pane displays the breakpoints of your lookup table as crosses and the operating points where there is data as blue dots. Data sets display the points in the experimental data, not the values at the breakpoints. You can inspect the spread of the data compared to the breakpoints of your lookup table before you fill the lookup table.
To view the lookup table after it is filled, ensure that the Show lookup table history after fill box, at the bottom left, is selected.
To fill the lookup table with values of
tqmeasextrapolated over the range of the normalizers, click Fill.The History dialog box opens.
Click Close to close the History dialog box and return to the Lookup Table Filler display.
To view the graph of your lookup table, as shown, select Data > Plot > Surface.
This display shows the lookup table filled with the experimental points overlaid as purple dots.
The lookup table has been calibrated by extrapolating over the values of your data and filling the values that the data predicts at your breakpoints.
Notice that the range of the lookup table is smaller than the range of the data, as the lookup table only has a range from 500 rpm to 3500 rpm.
The data outside the range of the lookup table affects the values that the lookup table is filled with. You can exclude the points outside the range of the lookup table so that only points in the range that you are interested in affect the values in the lookup table.
Select Data Regions
You can ignore points in the data set when you fill your lookup table.
For example, in this tutorial the experimental data ranges over values that are not included in the lookup table. You want to ignore the values of engine speed that are greater than the range of the lookup table.
To ignore points in the data set,
Select Data > Plot > Data Set. This returns you to the view of where the breakpoints lie in relation to the experimental data.
To define the region that you want to include, left-click and drag the plot. Highlight all the points that are included in your lookup table range, as shown.
To fill the lookup table based on an extrapolation over these data points only, click Fill. This opens the History display again.
In the History display, select version 2 and 3, using Ctrl+click. The following display shows a comparison between the lookup table filled with two different extrapolations.
Click Close to close the History viewer.
Select Data > Plot > Surface to view the surface again.
The display of the surface now shows the lookup table filled only by reference to the data points that are included in the range of the lookup table.
You have filled a lookup table with values taken from experimental data.
Export the Calibration
To export the calibration:
To highlight the lookup table that you want to export, click Lookup Tables.

Highlight the
New_2D_Table.Select File > Export > Calibration > Selected Item.
Choose the type of file you want to save your calibrations as. For the purposes of this tutorial, select
Comma Separated Value (.csv).Enter
table_filling_tutorial.csvas the file name and click Save.