View Your Optimization Results
After you run an optimization, lookup tables automatically update if the fill is defined,
either from previously using the fill wizard or using the Create Lookup Tables
from Models to create a tradeoff. An Output node appears
in the optimization tree and the Optimization Output view
appears. CAGE provides tools for analyzing your results with these views.
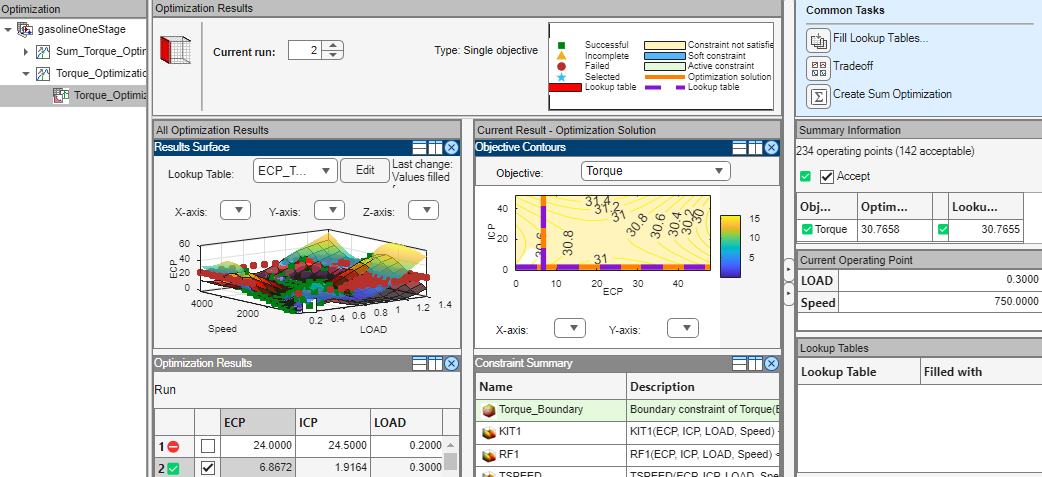
When analyzing optimization results, the top section of the Optimization Output view displays the current run, the objective type, and a legend that explains the meaning of the color coding and symbols. The view also displays the optimization results on the left-hand side (LHS) under All Optimization Results, and the optimization solution for the currently selected operating point on the right-hand side (RHS) under Current Result - Optimization Solution. You have the option to select an operating point from the Optimization Results table, the Current Run box, or directly from one of the results surface plots.
For example, the solution for an operating point selected in the Optimization Results table is visualized in the Objective Contours graph, and the value is displayed in the Summary Information table on the RHS. The fixed-variable values at that operating point are displayed in the Current Operating Point table.
Note
If there is only one fixed-variable, the optimization output will change from a surface to a curve, and if there is only one optimization variable, an optimization graph is shown instead of a contour.
Refer to the right of the Optimization Output view for a
list of lookup tables and the corresponding optimization results used to fill the lookup
tables. Different outcomes result from running fmincon for various
operating points. Green solutions are accepted by default and red solutions are not, but you
can manually select these solutions to add to the lookup table. This table shows the icons
that indicate the status of each optimization run.
Optimization Results Table Icons
| Icon | Description |
|---|---|
| Green square Accept icon | Indicates success (algorithm exit flag > 0 ). CAGE automatically selects the Accept check boxes for solutions where the algorithm exit flag indicates success (>0). These solutions show a green square icon next to the check box. Typically constraints are met within tolerance. |
| Orange triangle Accept icon | Indicates the optimization terminated early (exit flag = 0 ). This situation typically occurs when the optimizer has reached some form of time limit. Examples of this include exceeding a number of iterations or function evaluation limit. In such cases, the optimization was in progress but was forced to terminate before the optimal solution had been found. You could decide to accept these solutions or you could try changing tolerances and optimizing again. |
| Red circle Accept icon | Indicates failure (exit flag < 0 ). Typically this occurs due to the problem being over constrained for this run. |
When viewing your optimization results, use the Optimization Output view toolbar buttons to determine what is displayed in the table and the graph views. The default view of tables and graphs is dependent on the optimization type.
Use these toolbar buttons or the View menu to select these views.
Option | Optimization View |
|---|---|
Toolbar buttons or the View menu to select one of the solution slice views.
|
Note The Pareto, Selected Solution slices, and Select Solution function are only available for Multiple Objective or Modal optimizations. |
Toolbar buttons. You can split and add these views. Use the right-click context menu, the View menu, or the buttons in the view title bars.
| |
Solution menu.
|
|