About Life Tables
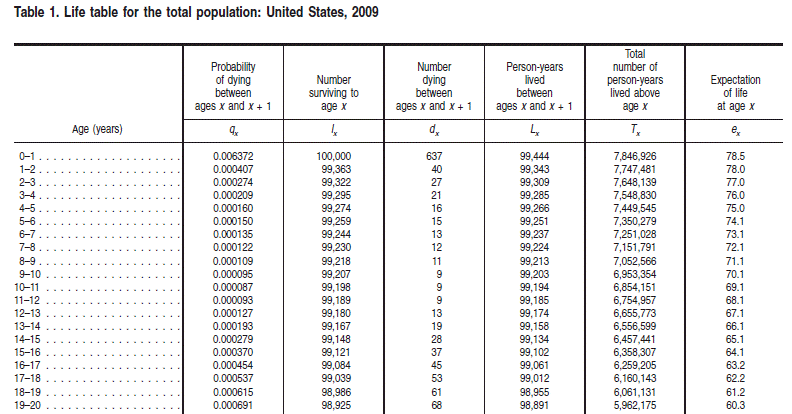
Life tables are used for life insurance and work with the probability distribution of human mortality. This distribution, which is age-dependent, has several characteristic features that are consequences of biological, cultural, and behavioral factors. Usually, the practitioners of life studies use life tables that contain age-dependent series for specific demographics. The tables are in a standard format with standard notation that is specific to the life studies field. An example of a life table is shown in Table 1 from CDC life tables for the United States.
Often, these life tables can have numerous variations such as abridged tables (which pose challenges due to the granularity of the data) and different termination criteria (that can make it difficult to compare tables or to compute life expectancies).
Most raw life tables have one or more of the first three series in this table (qx, lx, and dx) and the notation for these three series is standard in the field.
The qx series is basically the discrete hazard function for human mortality.
The lx series is the survival function multiplied by a radix of 100,000.
The dx series is the discrete probability density for the distribution as a function of age.
Financial Toolbox™ can handle arbitrary life table data supporting several standard models of mortality and provides various interpolation methods to calibrate and analyze the life table data.
Although primarily designed for life insurance applications, the life tables functions (lifetableconv, lifetablefit, and lifetablegen can also be used by social scientists, behavioral psychologists, public health officials, and medical researchers.
Life Tables Theory
Life tables are based on hazard functions and survival functions which are, in turn, derived from probability distributions. Specifically, given a continuous probability distribution, its cumulative distribution function is F(x) and its probability density function is f(x) = d F(x)/dx.
For the analysis of mortality, the random variable of interest X is the distribution of ages at which individuals die within a population. So, the probability that someone dies by age x is
The survival function, (s(x)), which characterizes the probability that an individual lives beyond a specified age x
> 0, is
For a continuous probability distribution, the hazard function is a function of the survival function with
and the survival functions is a function of the hazard function with
Life table models generally specify either the hazard function or the survival function. However, life tables are discrete and work with discrete versions of the hazard and survival functions. Three series are used for life tables and the notation is the convention. The discrete hazard function is denoted as
which is the probability a person at age x dies by age x + 1 (where x is in years). The discrete survival function is presented in terms of an initial number of survivors at birth called the life table radix (which is usually 100,000 individuals) and is denoted as
with radix l0 = 100000. This number, lx, represents the number of individuals out of 100,000 at birth who are still alive at age x.
A third series is related to the probability density function which is the number of "standardized" deaths in a given year denoted as
Based on a few additional rules about how to initialize and terminate these series, any one series can be derived from any of the other series.
See Also
lifetableconv | lifetablefit | lifetablegen