bioinfo.pipeline.Pipeline
Pipeline object to build and run end-to-end bioinformatics analyses and workflows
Since R2023a
Description
The bioinfo.pipeline.Pipeline object lets you construct and
execute bioinformatics pipelines and workflows to analyze genomic data.
Creation
Create the object using bioinfo.pipeline.Pipeline.
Properties
Object Functions
addBlock | Add blocks to pipeline |
blockName | Return the names of specified blocks in pipeline |
cancel | Cancel blocks in pipeline that are running in parallel |
compile | Verify pipeline structure and check for warnings and errors |
connect | Connect two blocks in pipeline |
copy | Copy array of handle objects |
deleteResults | Delete block results from pipeline |
disconnect | Remove connection between ports in a pipeline |
fetchResults | Wait for parallel-running block to finish and return its results |
findBlock | Get block objects from bioinformatics pipeline |
inputNames | Get names of unconnected block inputs from pipeline |
portMap | Show connected ports between two blocks |
processTable | Return information about all processes in pipeline |
removeBlock | Remove blocks from pipeline |
renameBlock | Rename block in pipeline |
results | Get bioinformatics pipeline results |
run | Run pipeline |
wait | Wait for running blocks to complete |
Examples
Import the Pipeline and block objects needed for the example.
import bioinfo.pipeline.Pipeline
import bioinfo.pipeline.block.*
Create a pipeline.
qcpipeline = Pipeline;
Select an input FASTQ file using a FileChooser block.
fastqfile = FileChooser(which("SRR005164_1_50.fastq"));Create a SeqFilter block.
sequencefilter = SeqFilter;
Define the filtering threshold value. Specifically, filter out sequences with a total of more than 10 low-quality bases, where a base is considered a low-quality base if its quality score is less than 20.
sequencefilter.Options.Threshold = [10 20];
Add the blocks to the pipeline.
addBlock(qcpipeline,[fastqfile,sequencefilter]);
Connect the output of the first block to the input of the second block. To do so, you need to first check the input and output port names of the corresponding blocks.
View the Outputs (port of the first block) and Inputs (port of the second block).
fastqfile.Outputs
ans = struct with fields:
    Files: [1×1 bioinfo.pipeline.Output]
sequencefilter.Inputs
ans = struct with fields:
    FASTQFiles: [1×1 bioinfo.pipeline.Input]
Connect the Files output port of the fastqfile block to the FASTQFiles port of sequencefilter block.
connect(qcpipeline,fastqfile,sequencefilter,["Files","FASTQFiles"]);
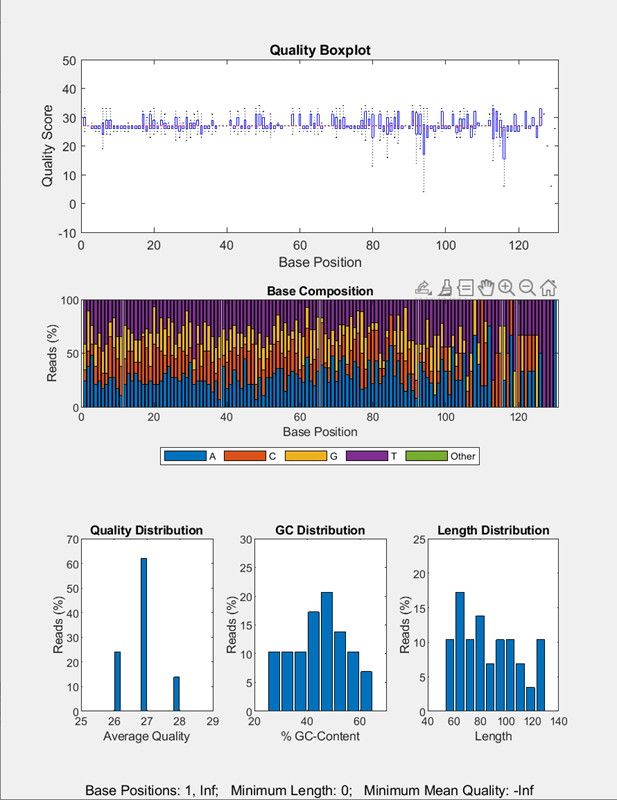
Next, create a UserFunction block that calls the seqqcplot function to plot the quality data of the filtered sequence data. In this case, inputFile is the required argument for the seqqcplot function. The required argument name can be anything as long as it is a valid variable name.
qcplot = UserFunction("seqqcplot",RequiredArguments="inputFile",OutputArguments="figureHandle");
Alternatively, you can also use dot notation to set up your UserFunction block.
qcplot = UserFunction;
qcplot.RequiredArguments = "inputFile";
qcplot.Function = "seqqcplot";
qcplot.OutputArguments = "figureHandle";
Add the block.
addBlock(qcpipeline,qcplot);
Check the port names of sequencefilter block and qcplot block.
sequencefilter.Outputs
ans = struct with fields:
    FilteredFASTQFiles: [1×1 bioinfo.pipeline.Output]
         NumFilteredIn: [1×1 bioinfo.pipeline.Output]
        NumFilteredOut: [1×1 bioinfo.pipeline.Output]
qcplot.Inputs
ans = struct with fields:
    inputFile: [1×1 bioinfo.pipeline.Input]
Connect the FilteredFASTQFiles port of the sequencefilter block to the inputFile port of the qcplot block.
connect(qcpipeline,sequencefilter,qcplot,["FilteredFASTQFiles","inputFile"]);
Run the pipeline to plot the sequence quality data.
run(qcpipeline);
Version History
Introduced in R2023a