メインコンテンツ

plot

R2026b

Visualize phased array layout and plot grating lobes, and efficiency

Since R2026b

    Description

    plot(obj) plots the phased array layout at 10 GHz. To use a different frequency for the plot, specify the Frequency name-value argument.

    example

    plot(___,Name=Value) plots the parameter specified using one or more name-value arguments.

    Examples

    collapse all

    Create a square phased array of rectangular patch antennas and set the expected array gain to 25 dBi. Choose the array operating frequency at 1.75 GHz.

    p = phasedArrayCalculator(RadiatingElement="rectanglepatch", ArrayGain=25)
    p = 
      phasedArrayCalculator with properties:
    
                     Lattice: 'square'
            RadiatingElement: 'rectanglepatch'
                   ArrayGain: 25
           ElementEfficiency: 100
           IlluminationTaper: 0
                   ScanAngle: 6
                   TaperLoss: 0
                 AntennaLoss: 0
           PointingErrorLoss: 0
            BeamDiameterLoss: 0
        ImplementationMargin: 0


    Visualize the array layout at 1.75 GHz.

    figure
    plot(p,Frequency=1.75e9)
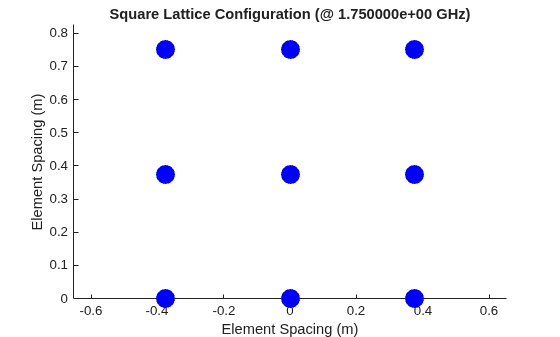
    Figure contains an axes object. The axes object with title Square Lattice Configuration (@ 1.750000e+00 GHz), xlabel Element Spacing (m), ylabel Element Spacing (m) contains an object of type scatter.

    Analyze grating lobes with reference to the array inter-element spacing.

    figure
    plot(p,Type="gratinglobe",Frequency=1.75e9);
    grid on
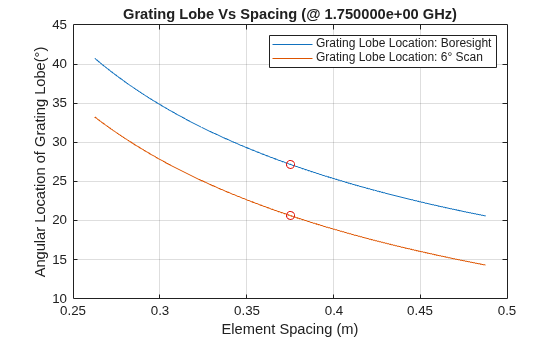
    Figure contains an axes object. The axes object with title Grating Lobe Vs Spacing (@ 1.750000e+00 GHz), xlabel Element Spacing (m), ylabel Angular Location of Grating Lobe(°) contains 4 objects of type line. These objects represent Grating Lobe Location: Boresight, Grating Lobe Location: 6° Scan.

    Analyze array efficiency with reference to radiation strength across array elements.

    figure
    plot(p,Type="efficiency",Frequency=1.75e9);
    grid on
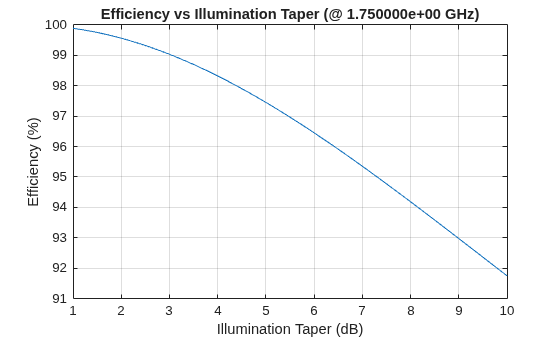
    Figure contains an axes object. The axes object with title Efficiency vs Illumination Taper (@ 1.750000e+00 GHz), xlabel Illumination Taper (dB), ylabel Efficiency (%) contains an object of type line.

    Input Arguments

    collapse all

    Phased array performance parameters, specified as a phasedArrayCalculator object.

    Name-Value Arguments

    collapse all

    Specify optional pairs of arguments as Name1=Value1,...,NameN=ValueN, where Name is the argument name and Value is the corresponding value. Name-value arguments must appear after other arguments, but the order of the pairs does not matter.

    Example: Type="gratinglobe"

    Array operating frequency, specified as a positive scalar. The default operating frequency is 10 GHz.

    Example: 15e9

    Data Types: double

    Type of parameter to plot, specified as one of the following strings:

    • "layout" — To plot array layout

    • "gratinglobe" — To plot grating lobes as a function of inter-element spacing

    • "efficiency" — To plot efficiency as a function of illumination taper

    Example: "efficiency"

    Data Types: string

    Version History

    Introduced in R2026b

    See Also

    Objects