View Server Instance Performance Metrics in Dashboard
In the MATLAB® Production Server™ on-premises dashboard, you can view metrics on the performance of a server instance. To view the metrics, from the leftmost navigation pane, select a server instance and then click the Performance tab.
The Performance tab displays several metrics.

CPU Percentage — Percentage of the server machine’s CPU used by the instance. On a multi-core machine, this number can exceed 100% since it reports the cumulative CPU usage from all cores.
Worker Processes — Number of active workers processing requests compared to Maximum Workers configured in the Settings tab of an instance.
Requests In Queue — Number of requests waiting to be completed.
Memory — Amount of memory the instance is using.
Throughput — Request throughput.
Total Queue Time — Total processing latency in seconds.
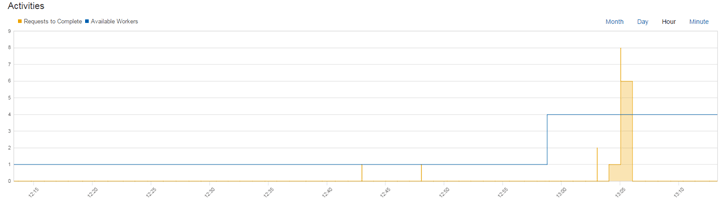
You can view a plot of the Requests to Complete and Available Workers over time in the Activities graph. This graph shows sample data. You can adjust the timescale displayed in the graph.
Related Topics
You can also select a web site from the following list:
Americas
- América Latina (Español)
- Canada (English)
- United States (English)
Europe
- Belgium (English)
- Denmark (English)
- Deutschland (Deutsch)
- España (Español)
- Finland (English)
- France (Français)
- Ireland (English)
- Italia (Italiano)
- Luxembourg (English)
- Netherlands (English)
- Norway (English)
- Österreich (Deutsch)
- Portugal (English)
- Sweden (English)
- Switzerland
- United Kingdom (English)