回答済み
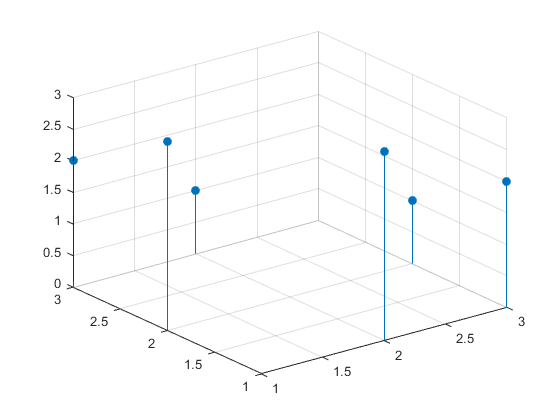
Change colour of points in plot3 with increasing z value
No, plot3 only supports a single color. You can use other graphics functions. The "traditional" one for this purpose is actually...
Change colour of points in plot3 with increasing z value
No, plot3 only supports a single color. You can use other graphics functions. The "traditional" one for this purpose is actually...
約10年 前 | 4
回答済み
Colorbar error "Too many input arguments." in matlab 2015b
This bit of the message: Error using parula Too many input arguments. Error in matlab.graphics.illustration.ColorBar ...
Colorbar error "Too many input arguments." in matlab 2015b
This bit of the message: Error using parula Too many input arguments. Error in matlab.graphics.illustration.ColorBar ...
約10年 前 | 1
回答済み
Graphics Pipeline: Viewspace & Back face culling
Are you sure your triangle orientations are consistent? For the calculations you're using for normals and backfaces, they mus...
Graphics Pipeline: Viewspace & Back face culling
Are you sure your triangle orientations are consistent? For the calculations you're using for normals and backfaces, they mus...
約10年 前 | 1
公開済み
Into the Mucube
Last time, when I was talking about permutohedra, we saw how truncated octahedra fill 3D space with no gaps. There are a...
約10年 前
回答済み
Does MATLAB R2014b require Graphics card to run fast.
It would depend on what your code is doing. A faster graphics card will only help with certain operations. Have you tried the...
Does MATLAB R2014b require Graphics card to run fast.
It would depend on what your code is doing. A faster graphics card will only help with certain operations. Have you tried the...
10年以上 前 | 0
回答済み
Removing white space inside MATLAB plot
Yet another option is to use this: axis tight This tells the rulers on the axes that they shouldn't round out to "nice" ...
Removing white space inside MATLAB plot
Yet another option is to use this: axis tight This tells the rulers on the axes that they shouldn't round out to "nice" ...
10年以上 前 | 4
| 採用済み
回答済み
Understanding the Color Matrix Input in surf()
From the help for the <http://www.mathworks.com/help/matlab/ref/gradient.html gradient function>: [FX,FY] = gradient(F) re...
Understanding the Color Matrix Input in surf()
From the help for the <http://www.mathworks.com/help/matlab/ref/gradient.html gradient function>: [FX,FY] = gradient(F) re...
10年以上 前 | 1
回答済み
imagesc, HeatMap or something else with non-rectangular cells
You can do heatmap like things with triangular meshes, but there is a bit of a learning curve. You're going to want to learn abo...
imagesc, HeatMap or something else with non-rectangular cells
You can do heatmap like things with triangular meshes, but there is a bit of a learning curve. You're going to want to learn abo...
10年以上 前 | 1
回答済み
How do I plot a contour map on the surface of a 3-d surface?
A simple tricky I use sometimes is to use a colormap with a small number of colors. [x,y] = meshgrid(linspace(-pi,pi,150));...
How do I plot a contour map on the surface of a 3-d surface?
A simple tricky I use sometimes is to use a colormap with a small number of colors. [x,y] = meshgrid(linspace(-pi,pi,150));...
10年以上 前 | 0
| 採用済み
回答済み
error using ezmeshc when using 'defaulttextinterpreter','latex'
The "EZ" functions make up nice titles and labels for you from the functions you give them. But they do that by generating TeX f...
error using ezmeshc when using 'defaulttextinterpreter','latex'
The "EZ" functions make up nice titles and labels for you from the functions you give them. But they do that by generating TeX f...
10年以上 前 | 1
公開済み
Tiling Hexagons and Other Permutohedra
In earlier posts we've looked at tiling quadrilaterals and pentagons. So what about hexagons? I'm sure you've seen tilings...
10年以上 前
回答済み
Can export_fig or else draw vector graphics with transparent surfaces?
I'm sure that Yair (the author of export_fig) will show up at some point with some good advice, but my understanding is that exp...
Can export_fig or else draw vector graphics with transparent surfaces?
I'm sure that Yair (the author of export_fig) will show up at some point with some good advice, but my understanding is that exp...
10年以上 前 | 2
回答済み
how to get the surface patch after delaunay triangulation
Have you tried the freeBoundary method as shown in the first example on <http://www.mathworks.com/help/matlab/ref/triangulation....
how to get the surface patch after delaunay triangulation
Have you tried the freeBoundary method as shown in the first example on <http://www.mathworks.com/help/matlab/ref/triangulation....
10年以上 前 | 0
| 採用済み
回答済み
Contour(X,Y,Z), grid contour with regard to probability or distance costs
Perhaps the <http://www.mathworks.com/help/matlab/ref/contourf.html contourf function> is what you're looking for. Another possi...
Contour(X,Y,Z), grid contour with regard to probability or distance costs
Perhaps the <http://www.mathworks.com/help/matlab/ref/contourf.html contourf function> is what you're looking for. Another possi...
10年以上 前 | 0
回答済み
How to make a gif of an already animated figure
You also need WriteMode=append or the imwrite keeps creating a new file. See the example at the end of <http://blogs.mathwor...
How to make a gif of an already animated figure
You also need WriteMode=append or the imwrite keeps creating a new file. See the example at the end of <http://blogs.mathwor...
10年以上 前 | 0
| 採用済み
回答済み
How to rotate an Alpha Shape, or points that defines the edge of a 3D shape?
Could you post your code? Here's a modified version of one of the examples: [x1, y1, z1] = sphere(24); x1 = x1(:); ...
How to rotate an Alpha Shape, or points that defines the edge of a 3D shape?
Could you post your code? Here's a modified version of one of the examples: [x1, y1, z1] = sphere(24); x1 = x1(:); ...
10年以上 前 | 1
| 採用済み
回答済み
How to implement a nonlinear grid into an image?
The image object won't do that. It does linear interpolation between the coordinates of its corners. You need to use a graphics ...
How to implement a nonlinear grid into an image?
The image object won't do that. It does linear interpolation between the coordinates of its corners. You need to use a graphics ...
10年以上 前 | 2
回答済み
How can I plot a combined of attached photos (triangular domain)?
Basically you want the technique I used in <http://blogs.mathworks.com/graphics/2014/11/18/what-is-a-surface/ this blog post abo...
How can I plot a combined of attached photos (triangular domain)?
Basically you want the technique I used in <http://blogs.mathworks.com/graphics/2014/11/18/what-is-a-surface/ this blog post abo...
10年以上 前 | 2
回答済み
With what command i can change the width of contours created with SURFC from the beginning?
The property is LineWidth, but things are a little tricky with surfc. The surfc command turns around and calls surf and contour....
With what command i can change the width of contours created with SURFC from the beginning?
The property is LineWidth, but things are a little tricky with surfc. The surfc command turns around and calls surf and contour....
10年以上 前 | 1
| 採用済み
回答済み
How to do triangulation after insert a new point
Perhaps <http://blogs.mathworks.com/loren/2015/07/15/incremental-delaunay-construction/ this post on Loren's blog> will help.
How to do triangulation after insert a new point
Perhaps <http://blogs.mathworks.com/loren/2015/07/15/incremental-delaunay-construction/ this post on Loren's blog> will help.
10年以上 前 | 0
| 採用済み
公開済み
Polygon Interpolation
I recently answered a question on MATLAB Answers about how patch interpolates color data. This is a question I get a lot...
10年以上 前
回答済み
Colouring Bars by 'Y' value
I would suggest the approach I described in <http://blogs.mathworks.com/graphics/2014/11/11/highlighting-parts-of-charts/ this b...
Colouring Bars by 'Y' value
I would suggest the approach I described in <http://blogs.mathworks.com/graphics/2014/11/11/highlighting-parts-of-charts/ this b...
10年以上 前 | 0
| 採用済み
回答済み
Is this distance variable?
Yes and no. The YLabel property of the axes is a handle to a text object, and you can set the Position property of that to m...
Is this distance variable?
Yes and no. The YLabel property of the axes is a handle to a text object, and you can set the Position property of that to m...
10年以上 前 | 2
| 採用済み
回答済み
what is the algorithms for computing Delaunay triangulations
The delaunayTriangulation class is built on top of the <http://www.cgal.org/ CGAL library>. You can find all of the details in <...
what is the algorithms for computing Delaunay triangulations
The delaunayTriangulation class is built on top of the <http://www.cgal.org/ CGAL library>. You can find all of the details in <...
10年以上 前 | 2
回答済み
Extract interpolated values from a surface fit?
I'm not quite sure what you mean when you're saying "raster form" here. I think that you just mean that you want to evaluate the...
Extract interpolated values from a surface fit?
I'm not quite sure what you mean when you're saying "raster form" here. I think that you just mean that you want to evaluate the...
10年以上 前 | 0
| 採用済み
回答済み
3d_visualisation
There are some utilities for this on <http://www.mathworks.com/matlabcentral/fileexchange/ the file exchange>, and there is the ...
3d_visualisation
There are some utilities for this on <http://www.mathworks.com/matlabcentral/fileexchange/ the file exchange>, and there is the ...
10年以上 前 | 0
| 採用済み
回答済み
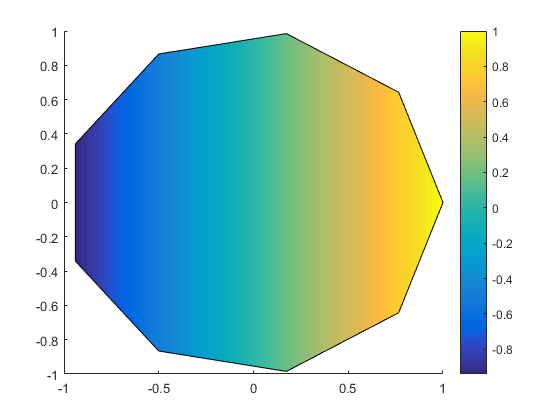
How can I paint a surface according to another scalar function?
Something like this? [x,y] = meshgrid(linspace(-2,2,50)); z = 4-x-y.^2; c = x.^2 - y; surf(x,y,z,c) <</matlabce...
How can I paint a surface according to another scalar function?
Something like this? [x,y] = meshgrid(linspace(-2,2,50)); z = 4-x-y.^2; c = x.^2 - y; surf(x,y,z,c) <</matlabce...
10年以上 前 | 0
| 採用済み
回答済み
why can't I call cftool in 2015matlab?
Perhaps you didn't install the <http://www.mathworks.com/help/curvefit/index.html Curve Fitting Toolbox> when you upgraded? That...
why can't I call cftool in 2015matlab?
Perhaps you didn't install the <http://www.mathworks.com/help/curvefit/index.html Curve Fitting Toolbox> when you upgraded? That...
10年以上 前 | 1
回答済み
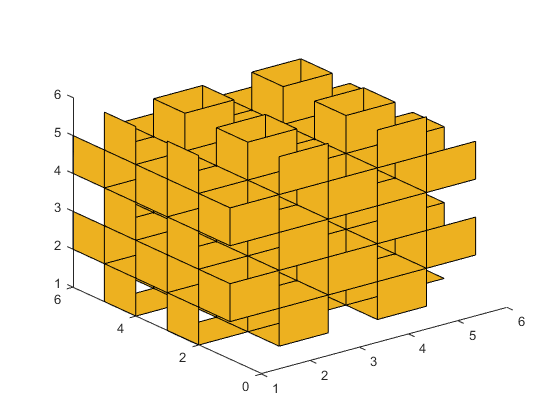
fill3 command working strangely?
I'm going to start with the geometry part of this and then come back to the colors. The help for both patch and fill3 use the...
fill3 command working strangely?
I'm going to start with the geometry part of this and then come back to the colors. The help for both patch and fill3 use the...
10年以上 前 | 0
| 採用済み
回答済み
How can I mesh a cylindrical scatter plot?
Trying to do this in Cartesian space might not be the best approach. You know that the points are nearly on the surface of a cyl...
How can I mesh a cylindrical scatter plot?
Trying to do this in Cartesian space might not be the best approach. You know that the points are nearly on the surface of a cyl...
10年以上 前 | 0