What are your x,y,z? What do you want to plot? Can you attach your data?
What inputs for pcolor
12 ビュー (過去 30 日間)
古いコメントを表示
Hi,
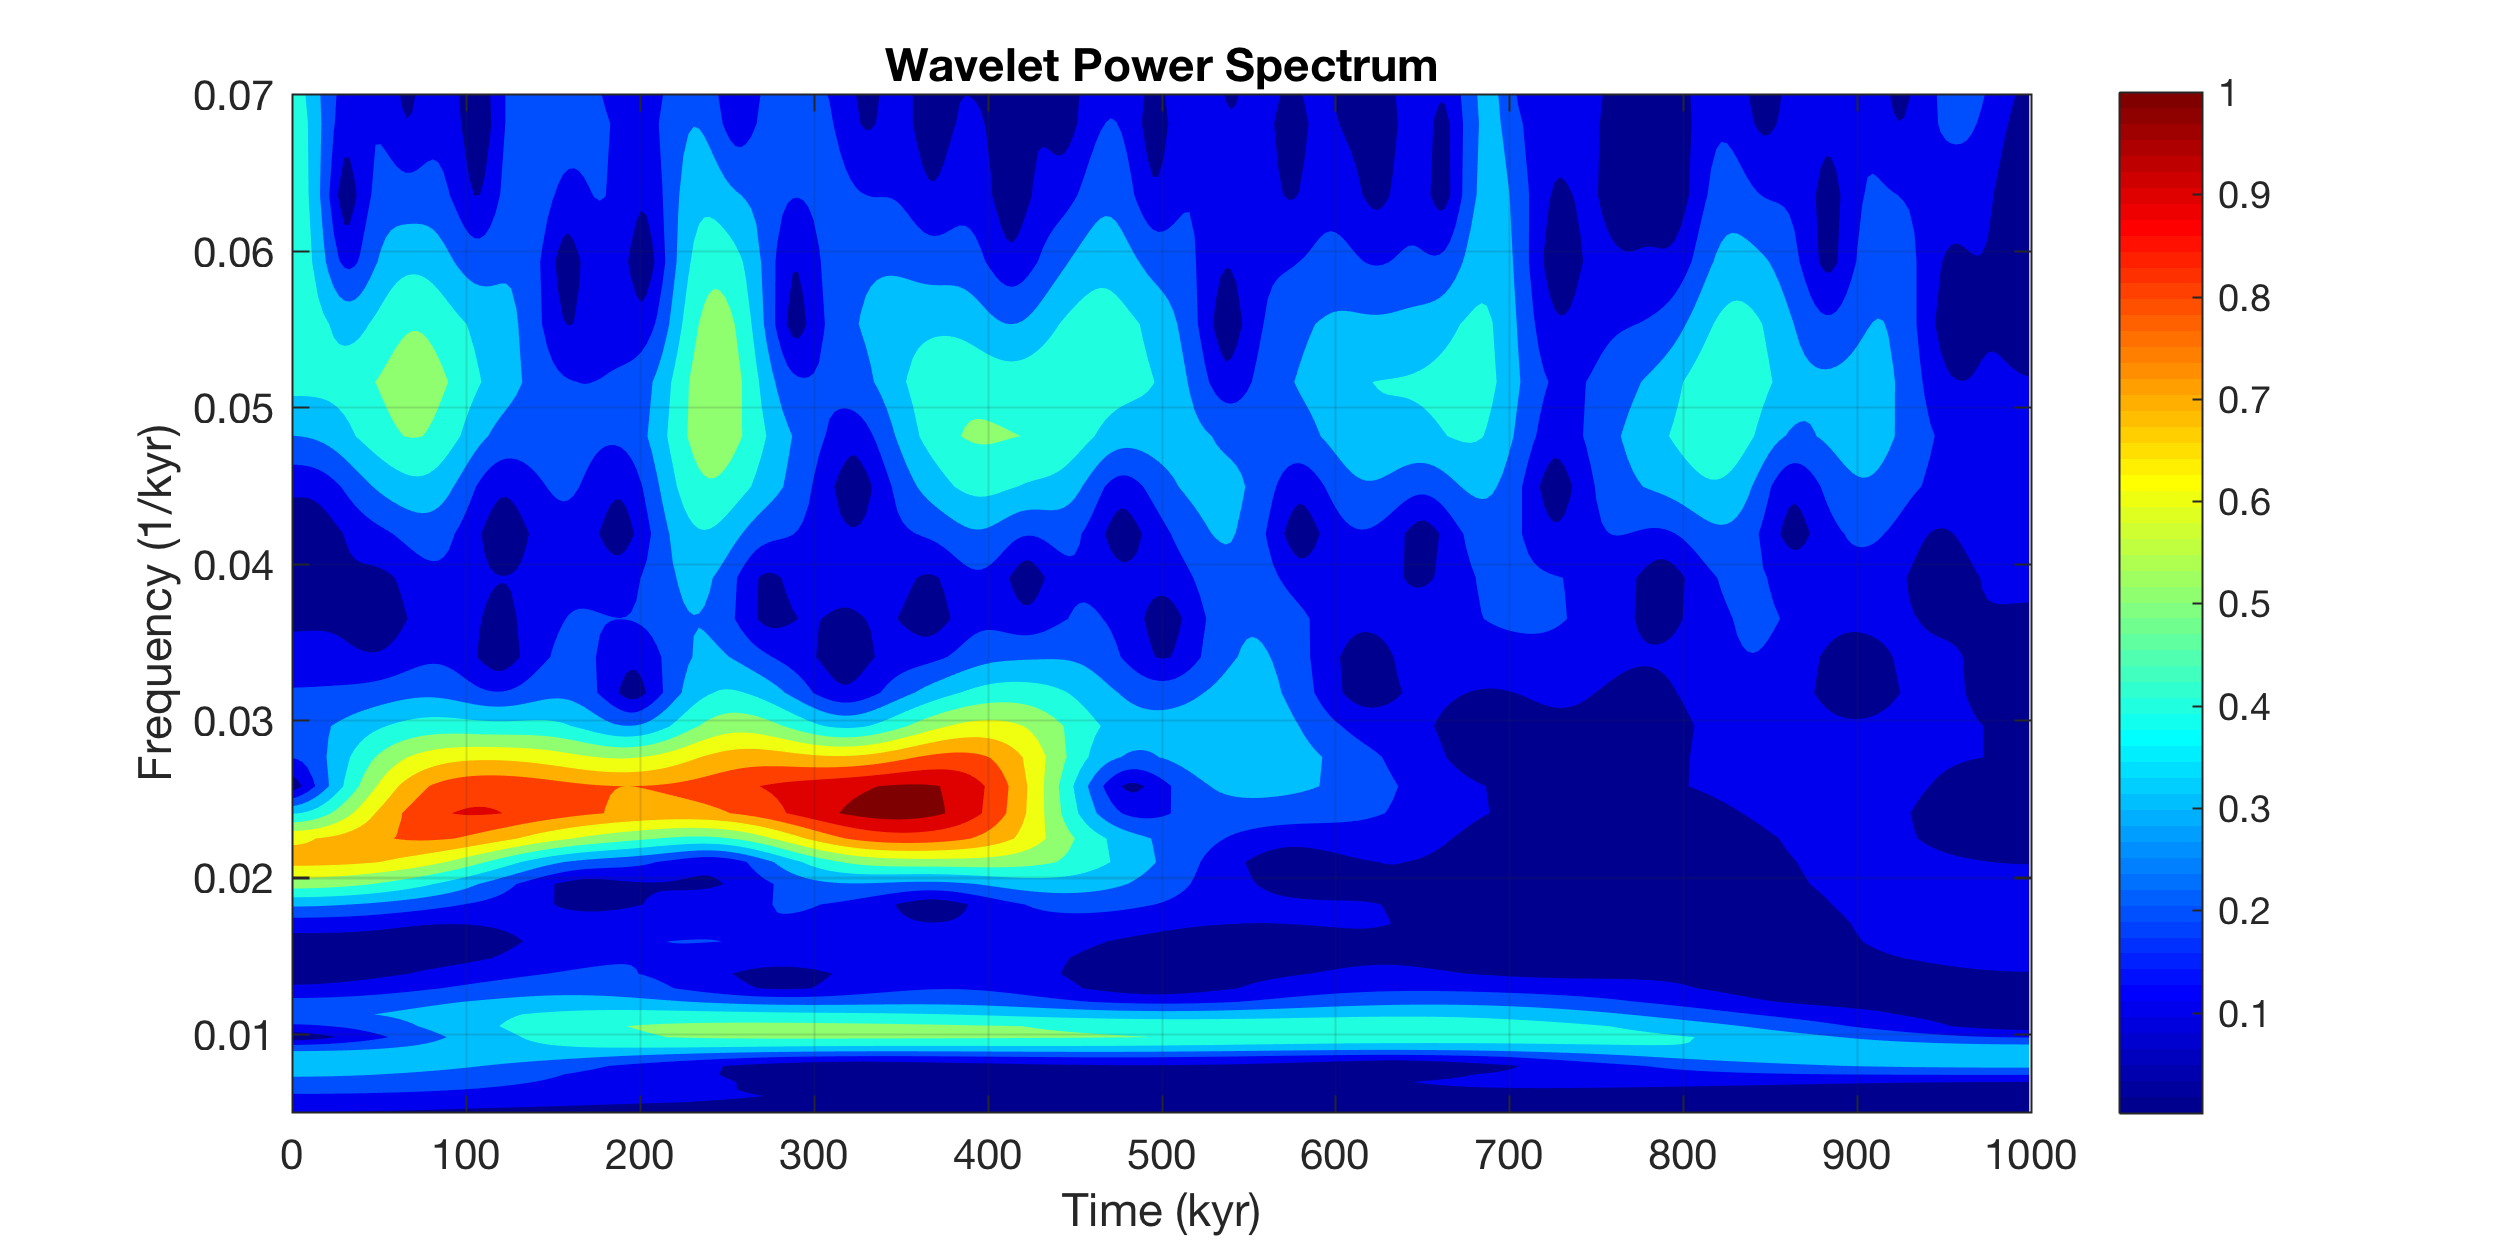
I am trying to generate a plot similar to this one:
I have a set of text files with two columns; Time in s and Velocity in m/s
I have a sampling freq of 20,000
I have generated a PSD using the code:
[Pxx, f] = pwelch(E,[],[],[],Fs);
where E is the all of the velocities and Fs is the sampling freq
How can I generate the above plot? What inputs should I put into the code:
pcolor(x,y,z)
Sizes:
E: 131072 1
f: 16385 1
Pxx: 16385 1
Sorry for the layout of the question, I dont understand enough to know how to ask the question eloquently
回答 (0 件)
参考
カテゴリ
Help Center および File Exchange で Parametric Spectral Estimation についてさらに検索
Community Treasure Hunt
Find the treasures in MATLAB Central and discover how the community can help you!
Start Hunting!
Translated by ![]()
また、以下のリストから Web サイトを選択することもできます。
南北アメリカ
- América Latina (Español)
- Canada (English)
- United States (English)
ヨーロッパ
- Belgium (English)
- Denmark (English)
- Deutschland (Deutsch)
- España (Español)
- Finland (English)
- France (Français)
- Ireland (English)
- Italia (Italiano)
- Luxembourg (English)
- Netherlands (English)
- Norway (English)
- Österreich (Deutsch)
- Portugal (English)
- Sweden (English)
- Switzerland
- United Kingdom (English)
アジア太平洋地域
- Australia (English)
- India (English)
- New Zealand (English)
- 中国
- 日本Japanese (日本語)
- 한국Korean (한국어)