view
View regression tree
Description
Examples
View Trained Regression Tree
View textual and graphical displays of a trained regression tree.
Load the carsmall data set. Consider a model that explains a car's fuel economy (MPG) using its weight (Weight) and number of cylinders (Cylinders).
load carsmall
X = [Weight Cylinders];
Y = MPG;
Train a regression tree using all measurements.
Mdl = fitrtree(X,Y);
View textual display of the trained regression tree.
view(Mdl)
Decision tree for regression
 1  if x1<3085.5 then node 2 elseif x1>=3085.5 then node 3 else 23.7181
 2  if x1<2371 then node 4 elseif x1>=2371 then node 5 else 28.7931
 3  if x2<7 then node 6 elseif x2>=7 then node 7 else 15.5417
 4  if x1<2162 then node 8 elseif x1>=2162 then node 9 else 32.0741
 5  if x2<5 then node 10 elseif x2>=5 then node 11 else 25.9355
 6  fit = 19.2778
 7  if x1<4381 then node 12 elseif x1>=4381 then node 13 else 14.2963
 8  if x1<1951 then node 14 elseif x1>=1951 then node 15 else 33.3056
 9  fit = 29.6111
10  if x1<2827.5 then node 16 elseif x1>=2827.5 then node 17 else 27.2143
11  if x1<3013.5 then node 18 elseif x1>=3013.5 then node 19 else 23.25
12  if x1<3533.5 then node 20 elseif x1>=3533.5 then node 21 else 14.8696
13  fit = 11
14  fit = 29.375
15  if x1<2142.5 then node 22 elseif x1>=2142.5 then node 23 else 34.4286
16  if x1<2385 then node 24 elseif x1>=2385 then node 25 else 27.6389
17  fit = 24.6667
18  fit = 21.5
19  fit = 30.25
20  fit = 16.6
21  if x1<4378 then node 26 elseif x1>=4378 then node 27 else 14.3889
22  if x1<2080 then node 28 elseif x1>=2080 then node 29 else 34.8333
23  fit = 32
24  fit = 24.5
25  if x1<2412.5 then node 30 elseif x1>=2412.5 then node 31 else 28.0313
26  if x1<4365 then node 32 elseif x1>=4365 then node 33 else 14.2647
27  fit = 16.5
28  fit = 34.125
29  fit = 36.25
30  fit = 34
31  if x1<2447 then node 34 elseif x1>=2447 then node 35 else 27.6333
32  if x1<4122.5 then node 36 elseif x1>=4122.5 then node 37 else 14.5313
33  fit = 10
34  fit = 24
35  if x1<2573.5 then node 38 elseif x1>=2573.5 then node 39 else 27.8929
36  if x1<3860 then node 40 elseif x1>=3860 then node 41 else 14.15
37  fit = 15.1667
38  fit = 27.125
39  if x1<2580 then node 42 elseif x1>=2580 then node 43 else 28.2
40  fit = 14.5
41  fit = 13.625
42  fit = 31
43  fit = 27.8889
View graphical display of the trained regression tree.
view(Mdl,Mode="graph");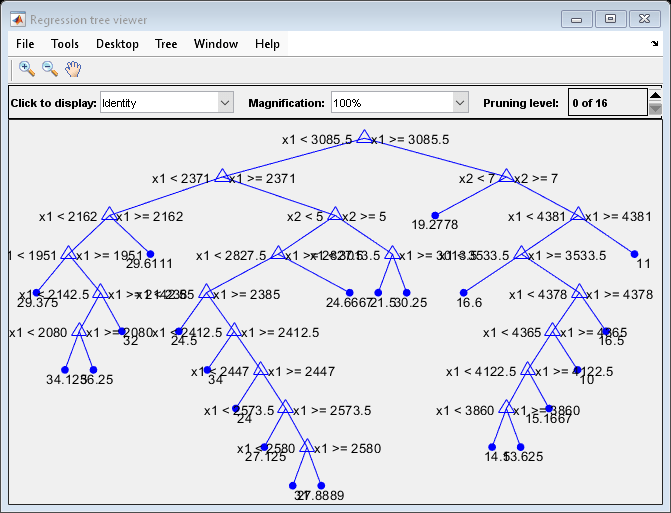
View Tree from Bag of Trees
Load the carsmall data set. Consider a model that explains a car's fuel economy (MPG) using its weight (Weight) and number of cylinders (Cylinders).
load carsmall
X = [Weight Cylinders];
Y = MPG;
Grow a bag of 100 regression trees using all measurements.
rng(1) % For reproducibility
Mdl = TreeBagger(100,X,Y);
Alternatively, you can use fitrensemble to grow a bag of regression trees.
Mdl is a TreeBagger model object. Mdl.Trees stores the bag of 100 trained regression trees in a 100-by-1 cell array. That is, each cell in Mdl.Trees contains a CompactRegressionTree model object.
View a graph of the 10th regression tree in the bag.
Tree10 = Mdl.Trees{10};
view(Tree10,'Mode','graph');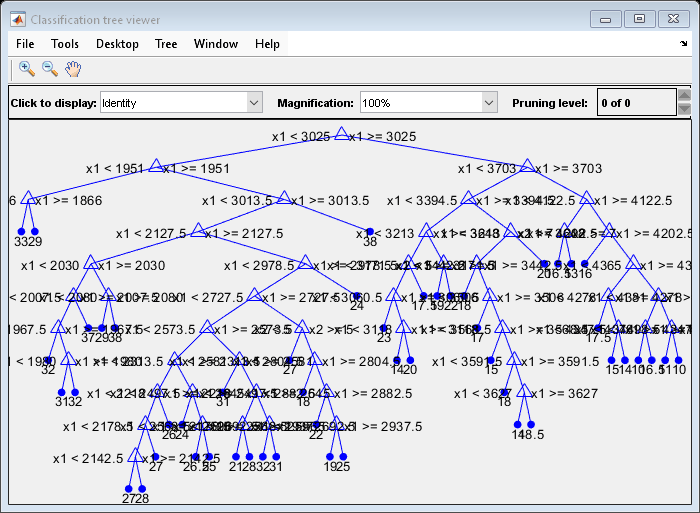
By default, the software grows deep trees for bags of trees.
View Tree from Boosted Ensemble
Load the carsmall data set. Consider a model that explains a car's fuel economy (MPG) using its weight (Weight) and number of cylinders (Cylinders).
load carsmall
X = [Weight Cylinders];
Y = MPG;
Boost an ensemble of 100 regression trees using all measurements.
Mdl = fitrensemble(X,Y,'Method','LSBoost');
Mdl is a RegressionEnsemble model object. Mdl.Trained stores the ensemble of 100 trained regression trees in a 100-by-1 cell array. That is, each cell in Mdl.Trained contains a CompactRegressionTree model object.
View a graph of the 10th regression tree in the ensemble.
Tree10 = Mdl.Trained{10};
view(Tree10,'Mode','graph');
By default, fitrensemble grows shallow trees for boosted ensembles of trees. That is, 'Learners' is templateTree('MaxNumSplits',10).
Input Arguments
Tips
To view tree t from an ensemble of trees, enter one of
these lines of code
view(Ens.Trained{t})
view(Bag.Trees{t})Ensis a full ensemble returned byfitrensembleor a compact ensemble returned bycompact.Bagis a full bag of trees returned byTreeBaggeror a compact bag of trees returned bycompact.
To save tree in the Command Window, get a
figure handle by using the findall and setdiff functions, and then save tree using the function
saveas.
before = findall(groot,Type="figure"); % Find all figures
view(Mdl,Mode="graph")
after = findall(groot,Type="figure");
h = setdiff(after,before); % Get the figure handle of the tree viewer
saveas(h,"a.png")
Extended Capabilities
Version History
Introduced in R2011aSee Also
You can also select a web site from the following list:
Americas
- América Latina (Español)
- Canada (English)
- United States (English)
Europe
- Belgium (English)
- Denmark (English)
- Deutschland (Deutsch)
- España (Español)
- Finland (English)
- France (Français)
- Ireland (English)
- Italia (Italiano)
- Luxembourg (English)
- Netherlands (English)
- Norway (English)
- Österreich (Deutsch)
- Portugal (English)
- Sweden (English)
- Switzerland
- United Kingdom (English)