Verify Frequency-Domain Characteristics of an Aircraft
This example shows how to check the whether the linear response of a Simulink® model satisfies frequency-domain requirements during simulation. To do so, you can use the Linear Analysis Plots and Model Verification libraries of Simulink Control Design™.
In this example, you check the gain and phase margins of an aircraft velocity control loop as the fuel load changes.
Aircraft Model
Open the aircraft Simulink model.
mdl = 'scdaircraft';
open_system(mdl)

The aircraft model is based on a long-haul passenger aircraft flying at cruising altitude and speed. The aircraft starts with a full fuel load and follows a prespecified eight hour velocity profile. The Simulink model is a simplified version of a velocity control loop that adjusts the fuel flow rate to control the aircraft velocity. The model includes elements to model fuel consumption and the resulting changes in aircraft mass as well as nonlinear draft effects limiting aircraft velocity. Constants used in the model, such as the drag coefficient, are defined in the model workspace.
Verify Loop Gain and Phase Margins
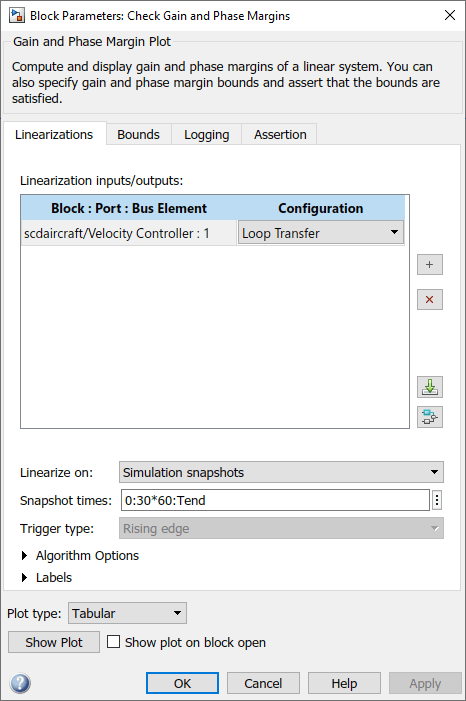
The aircraft model contains a Check Gain and Phase Margins block. This block computes the linearization of the loop seen by the Velocity Controller block every 30 minutes of simulated time.
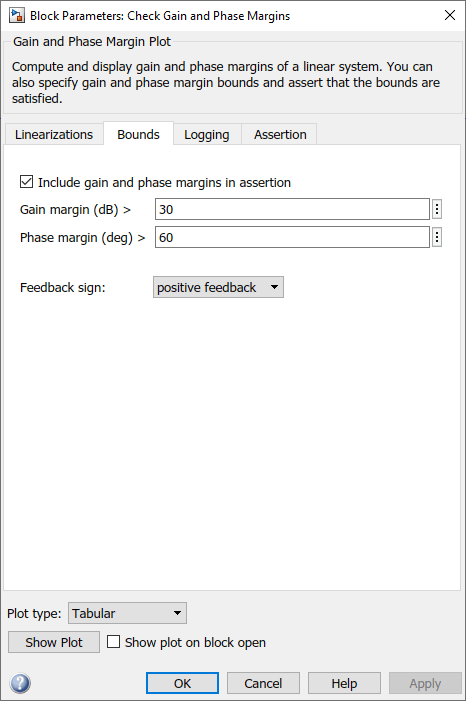
The block computes the loop gain and phase margins and checks whether the following conditions are satisfied.
Gain margin greater than 30 dB
Phase margin greater than 60 degrees
When computing the margins, the loop feedback sign must be specified. To determine the feedback sign, check if the linearization path defined by the linearization inputs and outputs includes the feedback summation.
If the path includes the summation block, use positive feedback.
If the path does not include the summation block, use the feedback defined by the summation block.
In this case, the linearization defined in the Check Gain and Phase Margins block includes the summation block with negative feedback. Therefore, compute the gain and phase margins using a positive feedback sign.
During the simulation, the block shows the computed gain and phase margins in a tabular format. To open the table, click Show Plot.
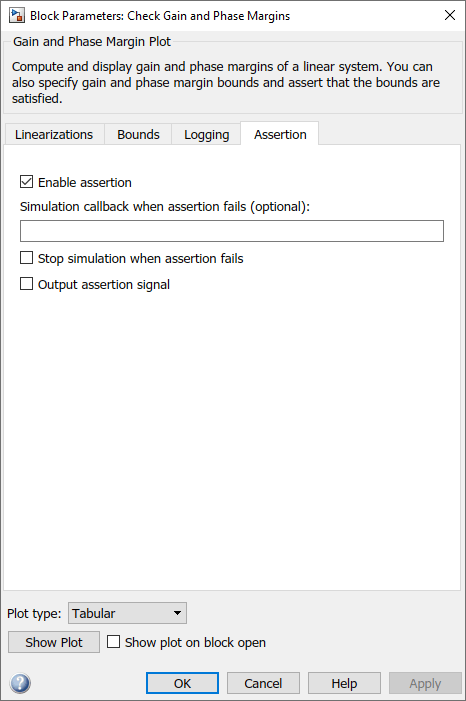
On the Assertion tab, the block is configured to throw a warning when the assertion fails, that is, when the gain and phase margins are not satisfied.
The model also includes a Nichols Plot block, which computes the loop response as the fuel mass drops during the simulation. The Generate dynamic range events block generates a rising edge whenever the fuel mass is a multiple of 10% of the maximum fuel mass. These rising edges trigger a linearization and display the results on the Nichols plot. To view the Nichols plot, open the Nichols Plot block and click Show Plot.
To check if the specified gain and phase margins are satisfied, simulate the model.
sim(mdl);
Warning: Assertion detected in 'scdaircraft/Check Gain and Phase Margins' at
time 27020.1
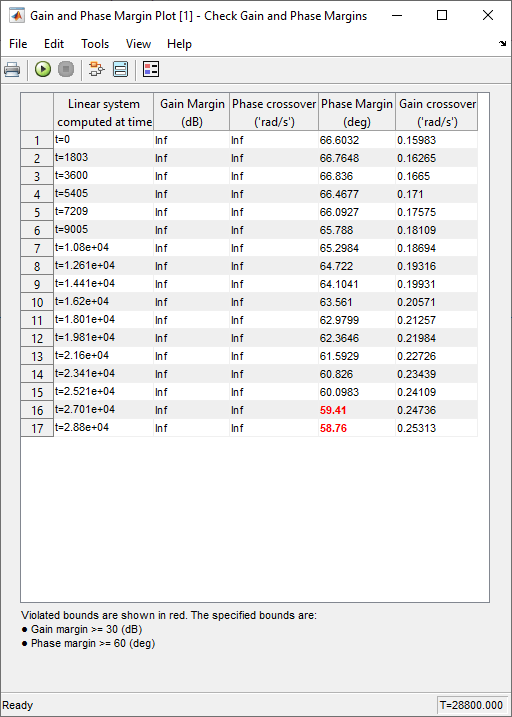

The tabular display from the Gain and Phase Margin block shows the following information.
Times when the control loop is linearized
Corresponding computed gain and phase margins.
Margins that violate the specified bounds are shown in red. The phase margin bound is violated towards the end of the simulation when the fuel mass and airplane velocity have dropped. The Nichols plot indicates the small loop response variations as the fuel load and aircraft velocity change.
The table shows that the linearizations are not computed at exactly every 30 min but at small variations of 30 min. This is because zero-crossing detection for the block is not enabled. Enabling zero-crossing for the block ensures that the linearizations are computed at exactly 30 min intervals but may increase the time the simulation takes to run.
To enable zero-crossing detection, you can select the Enable zero-crossing detection option on the block Linearizations tab or use the following command.
set_param('scdaircraft/Check Gain and Phase Margins','ZeroCross','on')
sim(mdl);
Warning: Assertion detected in 'scdaircraft/Check Gain and Phase Margins' at
time 27000

Log the Linear Systems
On the Logging tab, you can configure Linear Analysis Plots and Model Verification to log the computed linear systems to the MATLAB® workspace.
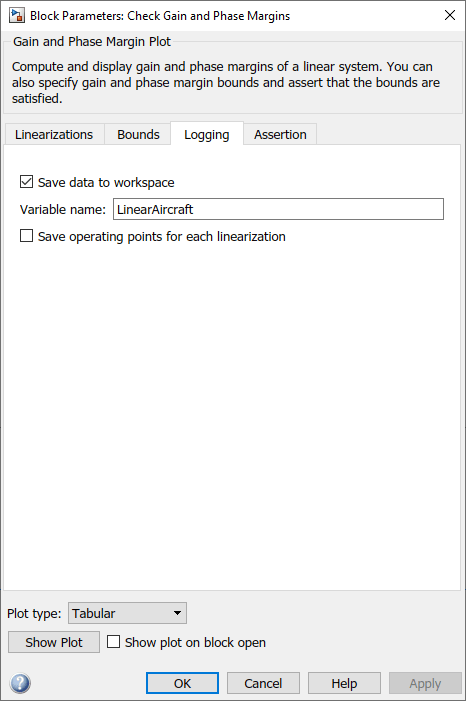
For this model, the Check Gain and Phase Margins block is configured to save the lienar systems in the structure LinearAircraft. This structure contains the linear systems and corresponding simulation times in the values and time fields, respectively.
LinearAircraft
LinearAircraft =

  struct with fields:

              time: [17x1 double]
            values: [1x1x17x1 ss]
         blockName: 'scdaircraft/Check Gain and Phase Margins'
    assertionValue: [17x1 logical]
The values field stores the linear systems as an array of LTI state-space systems. For more information, see Model Arrays.
You can retrieve the individual systems by indexing into the values field.
L = LinearAircraft.values(:,:,17)
L =

  A =
                 scdaircraft/  Continuous/I        Filter
   scdaircraft/      -0.01122             0             0
   Continuous/I      -0.01184             0             0
   Filter              0.7492             0       -0.4326

  B =
                 Velocity Con
   scdaircraft/        0.3774
   Continuous/I             0
   Filter                   0

  C =
                 scdaircraft/  Continuous/I        Filter
   Velocity Con    -1.998e-15             1       -0.4326

  D =
                 Velocity Con
   Velocity Con             0

Continuous-time state-space model.
Close the model. bdclose('scdaircraft')
Related Topics
You can also select a web site from the following list:
Americas
- América Latina (Español)
- Canada (English)
- United States (English)
Europe
- Belgium (English)
- Denmark (English)
- Deutschland (Deutsch)
- España (Español)
- Finland (English)
- France (Français)
- Ireland (English)
- Italia (Italiano)
- Luxembourg (English)
- Netherlands (English)
- Norway (English)
- Österreich (Deutsch)
- Portugal (English)
- Sweden (English)
- Switzerland
- United Kingdom (English)