Replay Data in the Simulation Data Inspector
This example shows how to replay data in the Simulation Data Inspector to inspect and build intuitive understanding of your data. When you replay data, a cursor sweeps synchronously across all the subplots in your view, displaying signal values. You can control the replay speed, pause to move the cursor sample-by-sample, and zoom to inspect your data. You can replay imported data and data logged from a simulation.
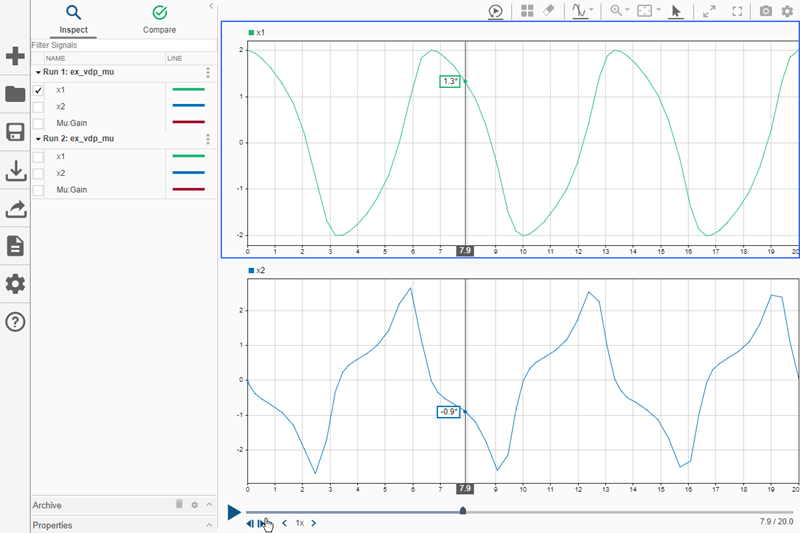
This example uses logged simulation data saved in a session. The session contains two runs of data logged from the ex_vdp_mu model. Data from Run 1: ex_vdp_mu is plotted in the viewing area.
Load the session and open the Simulation Data Inspector to view the data.
Simulink.sdi.load('ex_vdp_mu.mldatx');
Simulink.sdi.view
Replay Data
When you replay data, the Simulation Data Inspector animates synchronized cursors to move through a time period defined by the maximum time among the plotted signals. Replaying and pausing in the Simulation Data Inspector has no effect on any models or simulations.
To show the replay controls in the Simulation Data Inspector, click the Show/hide replay controls button. ![]()
Click the Replay button. ![]()
Synchronized cursors sweep across the subplots, indicating the signal value as the cursor moves in time. By default, the Simulation Data Inspector replays data at a rate of one second per second, meaning that the cursor moves through one second of data in the span of one second of clock time. You can adjust the replay speed to suit the data you want to inspect. By default, the Simulation Data Inspector replays at a speed of 1x. To change the speed, click one of the arrows on either side of the speed label or click the label and enter your desired replay speed.

The Simulation Data Inspector moves the cursor based on the maximum time in the plotted signals and the replay speed. The position of the cursor at a given time during replay does not depend on the time values for samples in the plotted signals. When the cursor position does not correspond with a sample in a plotted signal, the Simulation Data Inspector interpolates a value to display, using the method defined in the Interpolation property of the signal. An asterisk at the end of the cursor value indicates that the value is interpolated.
Inspect Data Values During Replay
To inspect sample values in your data, you can pause the replay. When the replay is paused, you can use the Step forward and Step backward buttons to move the cursor sample-by-sample. The cursors move to the next time point among all plotted signals. When a plotted signal does not have a sample, the Simulation Data Inspector interpolates the value.
Pause the replay and use the Step forward and Step backward buttons to view the signal values.
Zoom During Replay
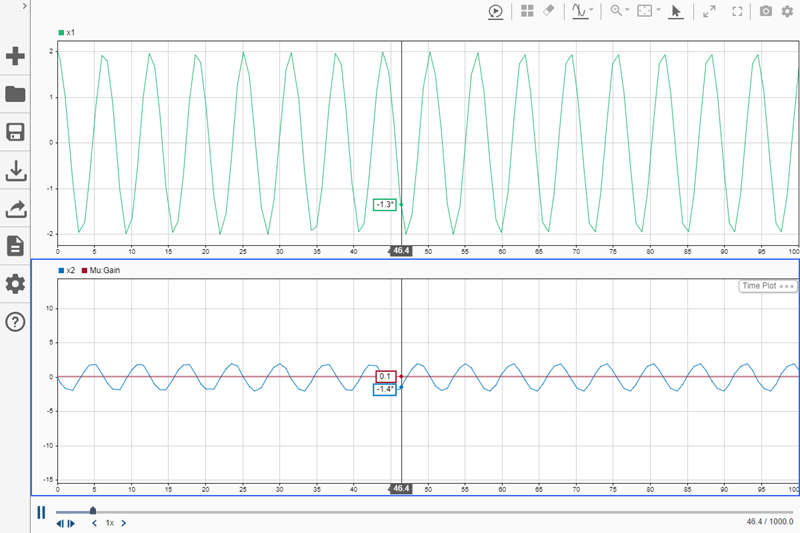
You can zoom in on a region of your data during replay to inspect signal values and relationships more closely. Viewing a portion of your signal can be particularly useful when your data spans a long duration with a high sample rate. For example, plot the signals from Run 2: ex_vdp_mu.
The data in run 2 corresponds to a much longer simulation of the ex_vdp_mu model, where the value of Mu changed over the course of the simulation. Viewing the entire signal at once makes analyzing the changing characteristics of the curve difficult. Before replaying the data, change the Time span in the Visualization settings to 100 to show the first 100 seconds. You can also collapse the navigation pane to allow the viewing area to occupy more space. Then, replay the data.
When the cursor nears the end of the zoomed portion of the data, click the Fit to view button to show the complete signal. Then, you can use the Zoom in time option to select another region of the signal to inspect more closely during the replay.
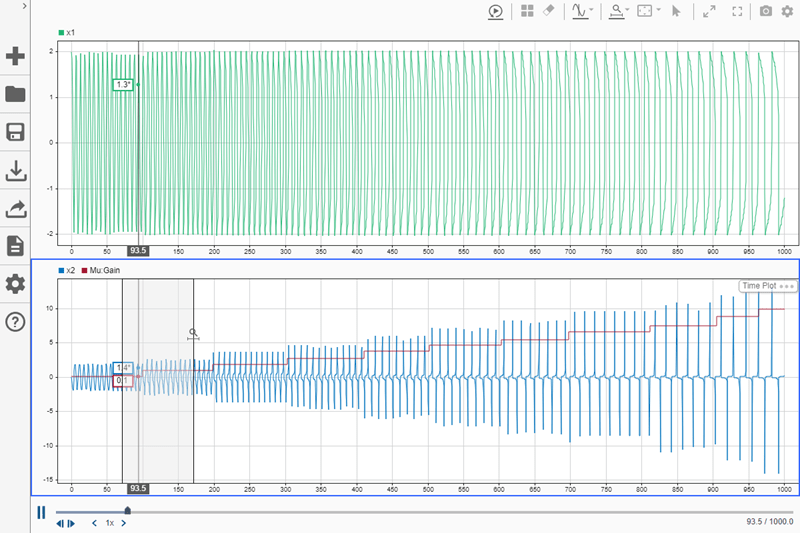
When replaying a long simulation, you can also adjust the replay speed or drag the time marker to replay data in an area of interest.
Related Topics
You can also select a web site from the following list:
Americas
- América Latina (Español)
- Canada (English)
- United States (English)
Europe
- Belgium (English)
- Denmark (English)
- Deutschland (Deutsch)
- España (Español)
- Finland (English)
- France (Français)
- Ireland (English)
- Italia (Italiano)
- Luxembourg (English)
- Netherlands (English)
- Norway (English)
- Österreich (Deutsch)
- Portugal (English)
- Sweden (English)
- Switzerland
- United Kingdom (English)