Label Signal Attributes, Regions of Interest, and Points
Recordings of whale songs contain trills and moans. Trills sound like series of clicks. Moans are low-frequency cries similar to the sound made by a ship's horn. You want to look at each signal and label it to identify the whale type, the trill regions, and the moan regions. For each trill region, you also want to label a few selected signal peaks.
Load Unlabeled Data
Start by loading a data set that includes two recordings of whale songs. The signals are called whale1 and whale2 and are sampled at 4 kHz. whale1 consists of a trill followed by three moans. whale2 consists of two moans, a trill, and another moan.
load labelwhalesignalsBring the signals into Signal Labeler:
Open Signal Labeler. On the Labeler tab, click Import and select
From Workspacein the Members list.In the dialog box, select the signals. Add time information: Select
Timefrom the drop-down list and enter the sample rateFs, which is measured in Hz.Click Import and Close to import the signals and then close the dialog box. The signals appear in the Labeled Signal Set Members. To plot any of the signals, you can select the check box next to its name in the browser.
To hear any of the signals, select the check box next to its name in the browser, navigate to the Audio tab, and click on the Play icon.
Add Signal Label Definitions
Define labels to attach to the signals. For more information about the kinds of labels you can define, see Create or Import Signal Label Definitions.
For the whale song signals:
Define a categorical attribute label to store whale types. Call it
WhaleType. The possible categories arebluewhale,humpbackwhale, andwhitewhale.Define a logical region-of-interest (ROI) label that is true for moan regions. Call it
MoanRegions.Define a logical ROI label that is true for trill regions. Call it
TrillRegions.Define a numeric point sublabel to capture trill peaks. Call it
TrillPeaks. Set this label as a sublabel of theTrillRegionslabel.
To define each label, click Add in the Label Definition section on the Labeler tab. To define the sublabel, select the TrillRegions label in the Label Definitions browser, click Add, and select Add sublabel definition.
Enter these values in the fields in the dialog box that appears for each signal label or sublabel definition. Leave the Default field empty in each case.
You can export the signal definitions you created to a MAT-file or to the MATLAB® Workspace by clicking Export. A dialog box appears that prompts you for a file name. At any point you can import signal definitions stored in a MAT-file by clicking Import.
Label Signal Attributes
The songs in the data are from two blue whales. You can set the WhaleType values for both signals simultaneously or for one signal at a time.
Set the WhaleType values for both signals:
Select
WhaleTypeon the Label Definitions browser.Click the Label All button in the Set Label Value section.
In the dialog box that appears, verify that both
whale1andwhale2are selected and that the Value field is set toblue. (If you do not specify a default value in a categorical signal label definition, Signal Labeler sets the label to the first category specified in the definition.)Click OK.
Set the WhaleType value for one signal at a time:
Check the box next to the signal name in the Labeled Signal Set Members.
Select
WhaleTypeon the Label Definitions browser.Click the Label Attribute button in the Set Label Value section. The value for
WhaleTypeappears in the Labeled Signal Set Members.Select the value for
WhaleTypefrom the Value drop-down list.
Plot the whale1 signal by selecting the check box next to its name. Signal attributes appear both in the Labeled Signal Set Members and under the time plot.

Label Signal Regions
Visualize the whale songs and label the trill and moan regions.
Trill regions have distinct bursts of sound punctuated by silence.
whale1has a trill centered at about 2 seconds.Moan regions are sustained low-frequency wails.
whale1has moans centered at about 7 seconds, 12 seconds, and 17 seconds.
Label the signals one at a time:
On the Plot column of the Labeled Signal Set Members, check the box next to the signal name to plot the signal.
To label a moan, on the Label Definitions browser, select the
MoanRegionslabel definition. Draw Labels is automatically activated.Click the time plot. A thick animated dashed line appears that expands into a shaded region when you click and drag.
Move and resize the active region until it encloses a moan region. For better label placement, you can go to the Display tab and activate the panner, or choose a zoom action at the top right corner of the time plot.
Click the Accept check mark in the Options section of the Labeler tab, press Enter, or double-click to label the ROI. The region changes to a gradient of the signal color. If you do not specify a default value in a logical label definition, Signal Labeler sets the label to
true.Repeat the procedure for the other two moans.
To label a trill, on the Label Definitions browser, select the
TrillRegionslabel definition. Label the trill region using steps 3, 4 and 5.Before labeling the second signal, remove the first signal from the plot by clearing the check box next to its name in the Labeled Signal Set Members. If you have the two signals plotted when you label a region or point, Signal Labeler associates the label with both signals.
Plot the two signals. The label viewer axes show the locations and widths of the regions of interest. They also show the value assigned to each region.

Label Signal Points
Trill regions have distinct peaks that correspond to bursts of sound. Label three peaks in each trill region. Because trill peaks are sublabels, each one must be associated with a particular TrillRegions label.
Label the signals one at a time:
On the Plot column of the Labeled Signal Set Members, check the box next to the signal name to plot the signal. Also check the box corresponding to the trill region whose peaks you want to label.
On the Label Definitions browser, select
TrillPeaks. Draw Labels is automatically selected.On the toolstrip, under Value, enter
1, corresponding to the first peak.On the Labeled Signal Set Members, select the trill region. The trill region is framed by a solid line.
Click the point on the time plot. An animated dashed (active) line appears for the point being labeled.
Move the active line until it crosses the signal at a peak of your choice. For better label placement, you can go to the Display tab and activate the panner, or choose a zoom action at the top right corner of the time plot.
Click the check mark in the Options section of the Labeler tab, press Enter, or double-click to label the peak. The dashed line changes to a solid line of the same color as the signal.
Repeat for two more peaks, entering
2and3under Value to identify them.Before labeling trill peaks for the second signal, remove the first signal from the plot by clearing the check box next to its name in the Labeled Signal Set Members.
The label viewer axes show the locations of the points of interest and the value assigned to each point.
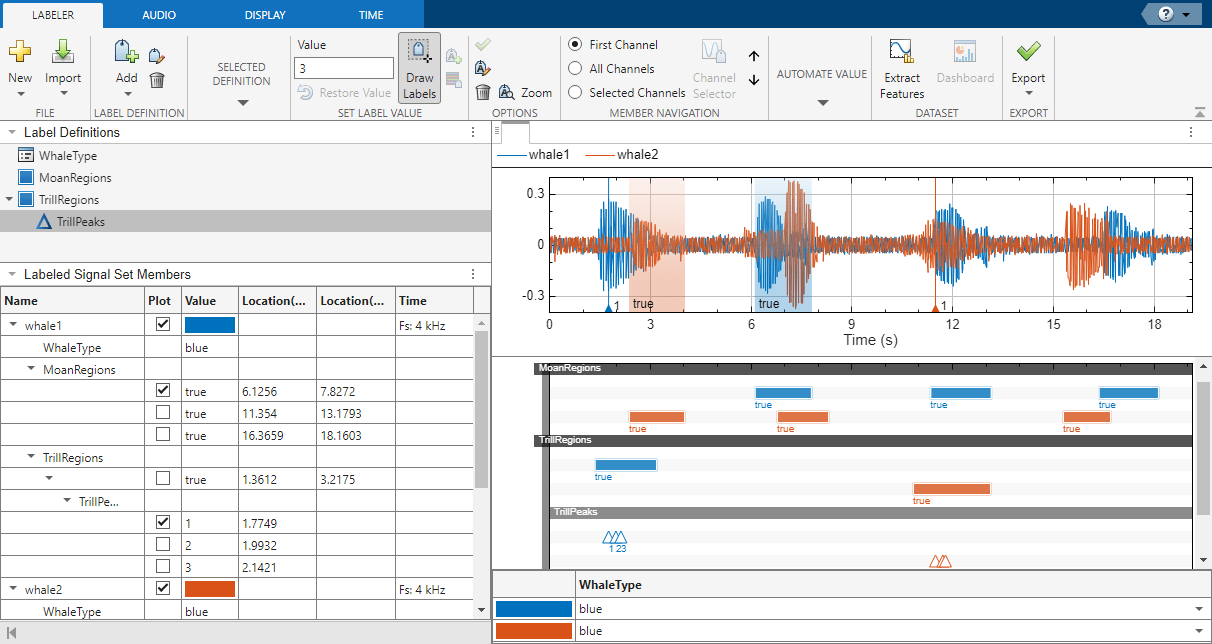
Plot the two signals to see a summary of their labels in the Label Viewer. Expand the labeled signal set hierarchy in the Labeled Signal Set Members to see details for all the labels. (To expand the hierarchy, right-click on the browser header and select Expand All.) For each signal, plot the first moan region and the first trill peak that you labeled.
Change Signal Line Color
To change the line color of a signal, right-click the member name and select Change Color, or click the color value in the Labeled Signal Set Members. Choose a standard or custom color from the Pick a Color dialog box.

Edit Signal Label Values
At any point, you can edit any signal label using the Labeled Signal Set Members, the time plot, or the label viewer. For more information, see Edit Labels.
Export Labeled Signal Set
Export the labeled signals as a new labeledSignalSet object. You can export the labeled signal set to the MATLAB Workspace or to a MAT-file. For this example, choose a MAT-file. On the Labeler tab, click Export and select To File from the Labeled Signal Set list. In the dialog box that appears, give the name Whale_Songs.mat to the labeled signal set, add an optional short description, and click Export. See Export Labeled Signal Sets and Signal Label Definitions for more information on how Signal Labeler exports labeled signal sets.
See Also
Apps
Objects
Related Examples
- Label ECG Signals and Track Progress
- Examine Labeled Signal Set
- Automate Signal Labeling with Custom Functions
- Label Spoken Words in Audio Signals
More About
- Using Signal Labeler App
- Import Data into Signal Labeler
- Create or Import Signal Label Definitions
- Label Signals Interactively or Automatically
- Custom Labeling Functions
- Customize Labeling View
- Feature Extraction Using Signal Labeler
- Dashboard
- Export Labeled Signal Sets and Signal Label Definitions
- Signal Labeler Usage Tips
You can also select a web site from the following list:
Americas
- América Latina (Español)
- Canada (English)
- United States (English)
Europe
- Belgium (English)
- Denmark (English)
- Deutschland (Deutsch)
- España (Español)
- Finland (English)
- France (Français)
- Ireland (English)
- Italia (Italiano)
- Luxembourg (English)
- Netherlands (English)
- Norway (English)
- Österreich (Deutsch)
- Portugal (English)
- Sweden (English)
- Switzerland
- United Kingdom (English)