Regenerative and Friction Braking Control
This example shows how to model a regenerative braking system in vehicles. Regenerative braking systems in vehicles capture and store energy that would otherwise be lost during braking. Specifically, regenerative braking systems convert vehicle kinetic energy to electrical energy, which would otherwise be dissipated as heat. This electrical energy returns to the battery where the vehicle can use it. Modeling a regenerative braking system allows you to predict the behavior of a design, compare several designs, and find the optimal design.
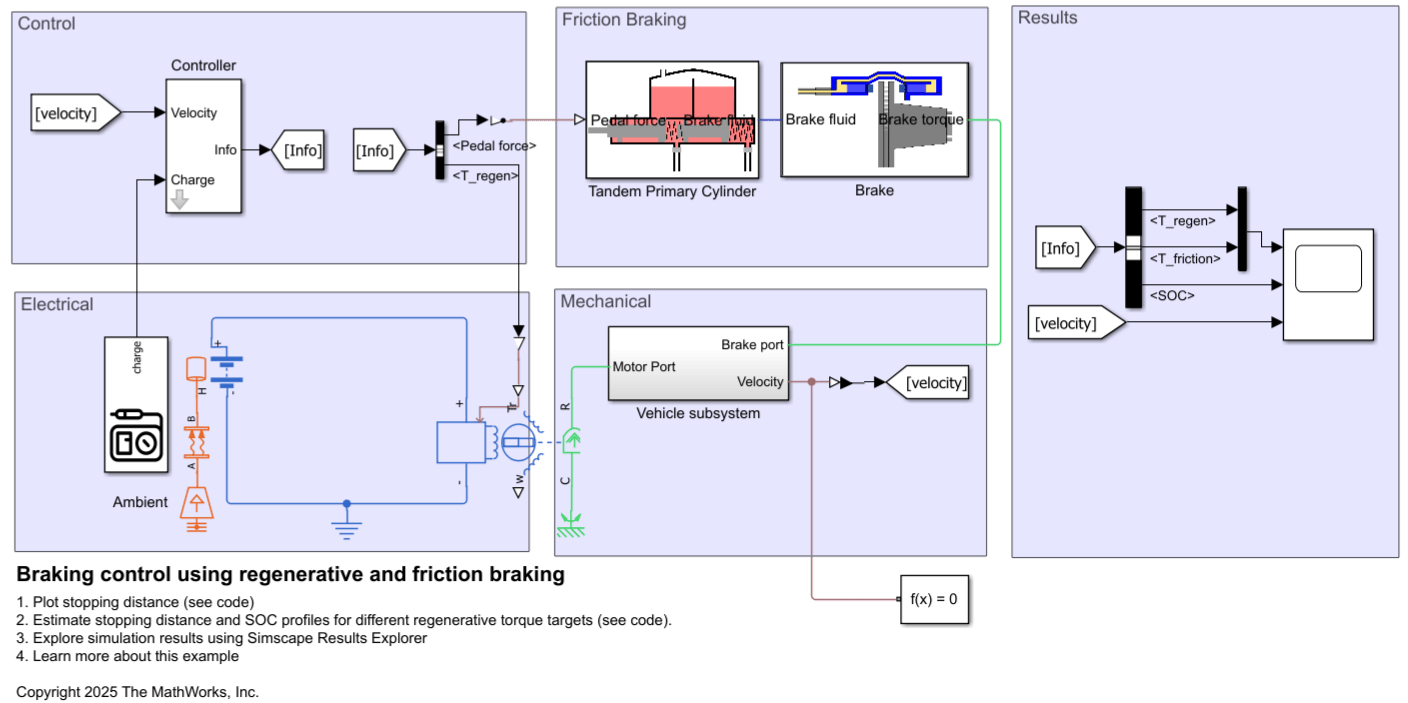
This model uses Simscape™ and Simulink® to represent a regenerative braking system that includes friction braking. One application of the model is assessing the impact of maximum regenerative capacity to optimize regeneration.
Model
The model consists of a physical system and a controller. The physical system includes the regenerative and friction braking components, the battery, and the vehicle dynamics. The controller controls the distribution of the braking torque load to the regenerative and friction braking systems. The controller determines the distribution based on factors such as the required braking torque, current vehicle speed, and the battery’s state of charge (SoC). Simscape is used to model the electrical, mechanical, and hydraulic systems, while Simulink handles signal flow and the implementation of control algorithms. For simplicity, this example focuses on a single wheel, which supports one-fourth of the vehicle’s total mass.
Regenerative Braking
Regenerative braking relies on torque control governed by the controller, which calculates the required regenerative torque based on instantaneous velocity and SoC. The controller also calculates the necessary pedal force for frictional braking. To generate the required regenerative torque, the Motor & Drive block implements torque control, or equivalently current control. When the required regenerative torque is negative while the vehicle is moving forward, the torque functions to brake the vehicle during which, the regenerative braking system converts mechanical energy into electrical energy, which it then stored in the battery.
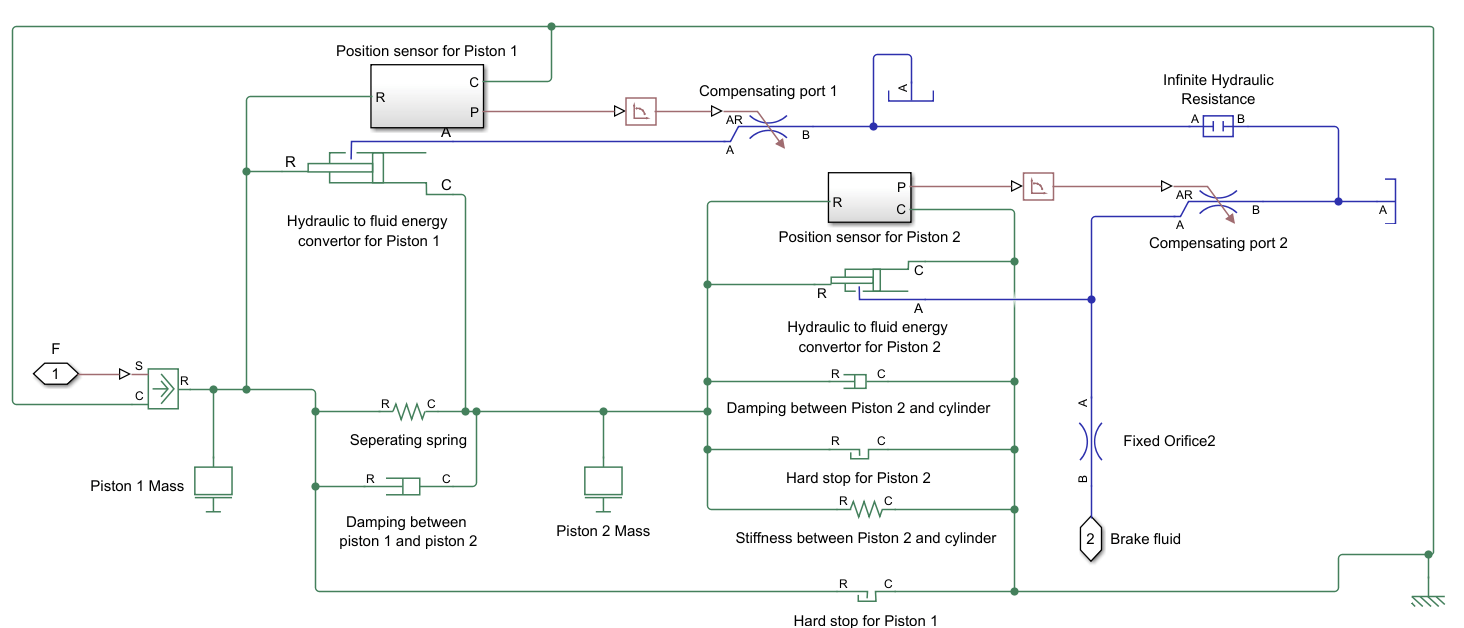
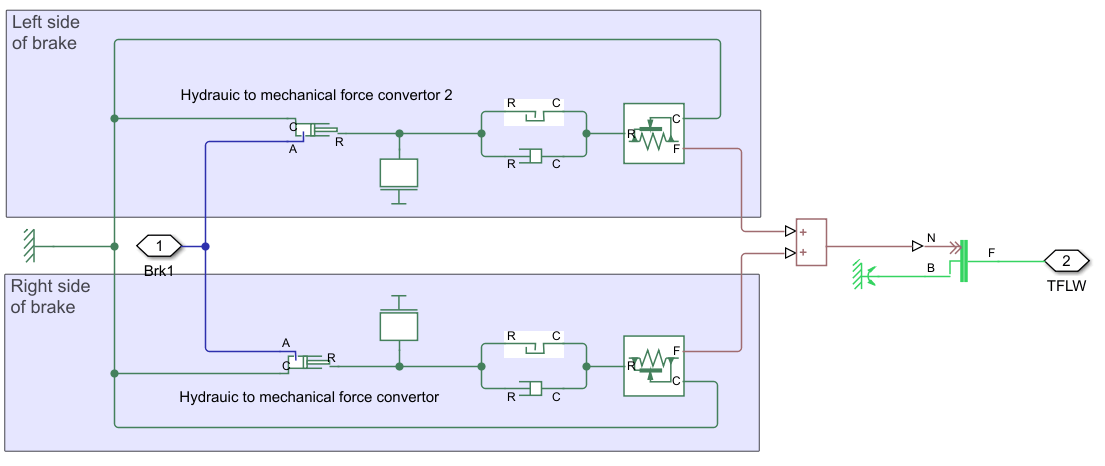
Friction Braking
The friction braking component uses the system in the Fixed Caliper Disk Brake example. This brake consists of a Tandem Primary Cylinder (TPC) subsystem and a Fixed Caliper Disc Brake (FCDB) subsystem, each of which are shown below.
The figure shows the TPC subsystem.
This figure shows the FCDB subsystem.
Battery
The model uses the Battery (System-Level) block to represent the battery. The following table shows the parameter settings for the Battery (System-Level) block:
Parameter | Value |
Open-circuit voltage across battery | |
Internal resistance | |
Maximum battery charge capacity | |
Initial battery charge | |
Thermal mass for battery convective cooling | |
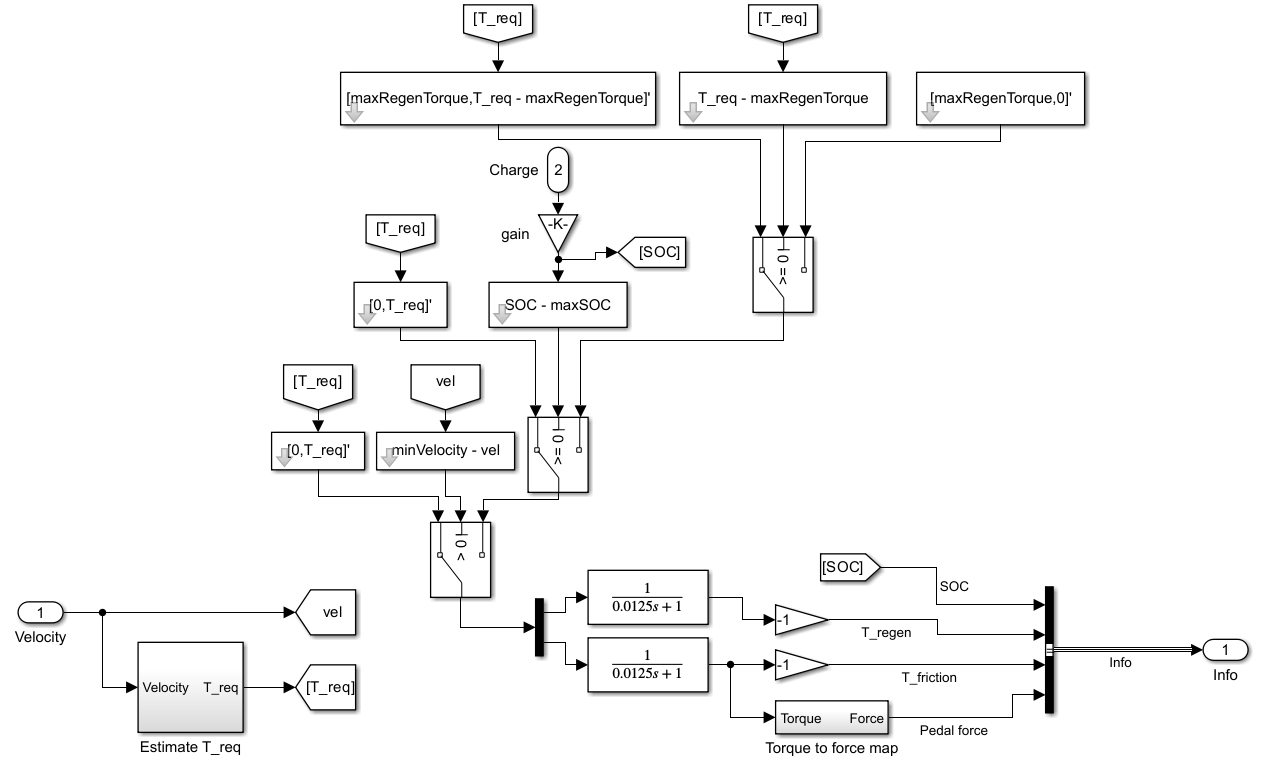
Control Logic
The flowchart displays the control logic, as described by Yang et. al. [2].
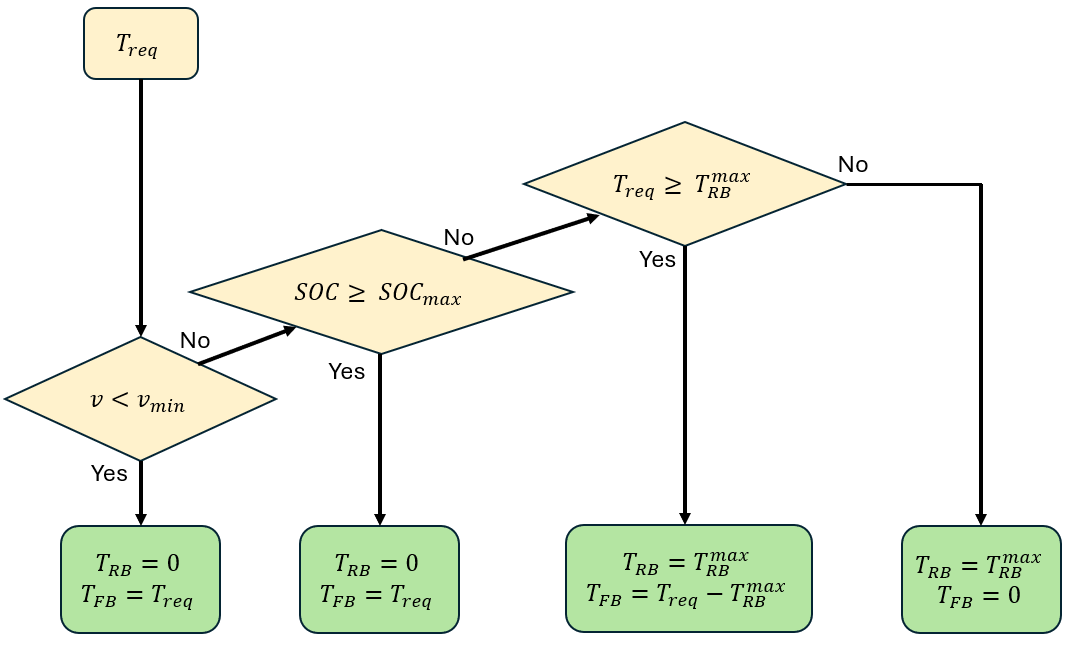
The flowchart refers to these quantities:
— Required total braking torque, which is fixed to a constant for decelerating the vehicle at
— Vehicle forward velocity
— Regenerative braking torque
— Friction braking torque
— State-of-charge
— Maximum possible
— Maximum possible
— Minimum velocity at which regeneration can be achieved when required is
The Simulink controller uses Simulink Logic Operation blocks. To view the controller logic, look inside the mask of the controller subsystem.
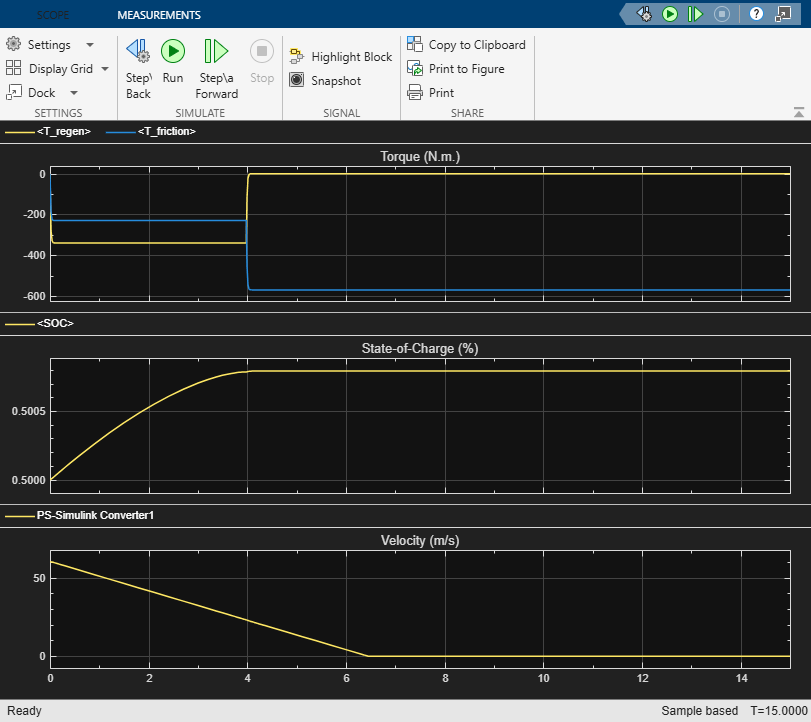
Simulation Results from Scope
The results show the profiles of battery state-of-charge, required regenerative and frictional torques, and vehicle velocity as the time progresses.
open_system('RegenerativeFrictionBrakingControl');
open_system('RegenerativeFrictionBrakingControl/Scope');
sim('RegenerativeFrictionBrakingControl');
Simulation Results from Simscape Logging
To gain further insight into the regenerative braking control, conduct the following two analyses. First, plot the vehicle velocity versus travel distance, including the instances of braking onset for regenerative and friction braking, regenerative braking commencement, and vehicle at rest. To generate this plot, enter:
close_system('RegenerativeFrictionBrakingControl/Scope',0);
RegenerativeFrictionBrakingControlPlot1StoppingDistance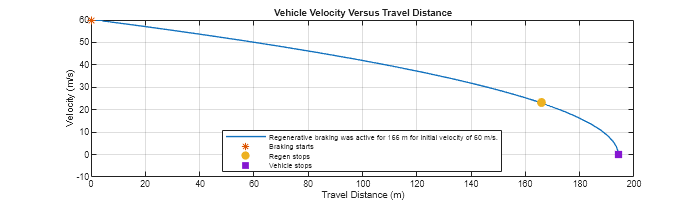
Second, analyze how the battery charging (State-of-Charge versus time) and vehicle stopping distance vary when varies. To conduct this analysis and plot the velocity versus travel distance and State-of-Charge vs time profiles at different , enter:
RegenerativeFrictionBrakingControlPlot2ComparePerformance
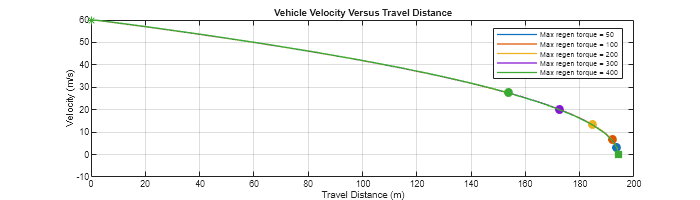
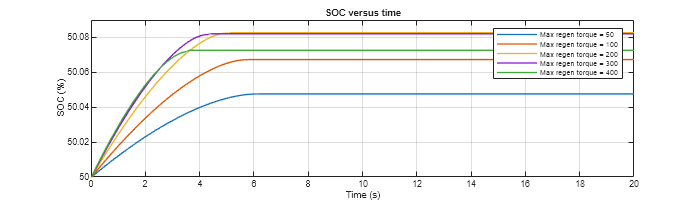
In the 'Vehicle Velocity versus Travel Distance' plot above, asterisks represent the braking onset, filled circles represent regenerative braking commencement, and filled squares represent vehicle stopping instances, respectively.
As increases, while the stopping distance remains the same due to the identical target for the total braking torque, the first increases and then decreases. In other words, the charging is maximum at an intermediate .
References
[1] Sato, Noboru. "Thermal behavior analysis of lithium-ion batteries for electric and hybrid vehicles." Journal of power sources 99.1-2 (2001): 70-77.
[2] Yang, Chao, et al. "Regenerative braking system development and perspectives for electric vehicles: An overview." Renewable and Sustainable Energy Reviews 198 (2024): 114389.