View Sections of Call Graph When Program Call Graph Is Too Large
Issue
In the Polyspace® Platform user interface, before authoring tests, you parse C/C++ source files to extract information required for test authoring. Following the code analysis, you can view a graphical representation of the function call graph of your program. To see this graphical representation, click Call Graph on the Polyspace Platform toolstrip.
If your program has too many function calls to display the full call graph, an orange ![]() badge appears in the upper-left corner of the call graph.
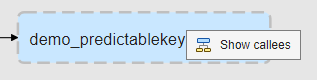
Some nodes in this partial call graph appear with a dashed outline, which means that their
child nodes are not displayed.
badge appears in the upper-left corner of the call graph.
Some nodes in this partial call graph appear with a dashed outline, which means that their
child nodes are not displayed.
Possible Solutions
When you see the orange Partial View badge on a call graph, it means the graph is too large to view all at once and not all child nodes are displayed. You can zoom and pan through the large call graph, and if you come across a node with a dashed outline, use the Show Callees context menu to view the callees of that node.
You can also view a section of the call graph starting from a specific function in your program. To do so:
Click Code Explorer on the Polyspace Platform toolstrip.
Under the Functions node, locate the function whose call graph you want to see. Right-click the function and select View Call Graph.
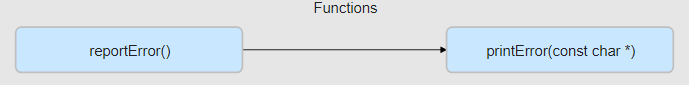
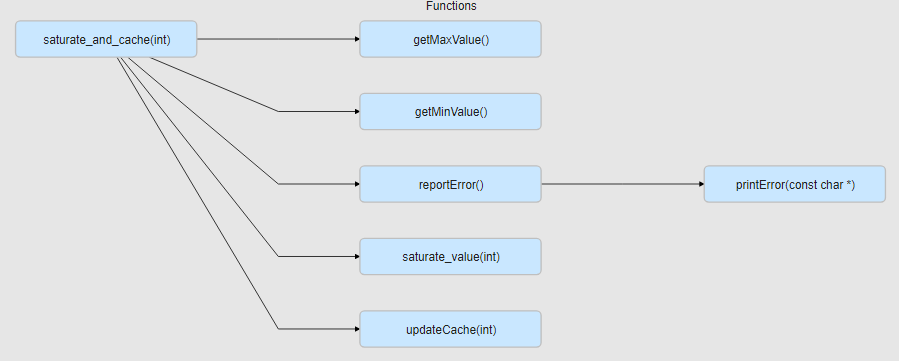
You see the section of the program call graph starting from that function. In other words, you see the function and its callees (both direct and indirect).
For instance, in the above example, you can use this method to see the section of the call graph starting from the reportError function.