Explore Multimodal Medical Image Data Using Medical Volume Viewer
R2026bThis example shows how to display positron emission tomography (PET) and computed tomography (CT) scans together with segmentation labels in the Medical Volume Viewer app.
A medical imaging modality is the technique used to capture the image, such as X-ray, magnetic resonance imaging (MRI), or CT. Multimodal imaging refers to viewing multiple modalities together to obtain a more complete picture of the overall health of a patient. For example, you can view how the map of the PET signal aligns with the detailed anatomical structures visible in the CT volume and verify that any segmentation label masks include the correct region of interest.
In this example, you import CT and PET scans acquired for one patient with labels to create a multimodal overlay in the Medical Volume Viewer app. To display a CT and PET overlay programmatically, see Display Multimodal Medical Image Data from PET and CT. The app simplifies multimodal visualization by automatically applying spatial metadata, which allows scans with different voxel spacing to display correctly in world coordinates without needing to resample.
Download Data
This example uses a subset of data from one subject in a data set containing CT and PET images [1][2]. The size of the subset of data is approximately 137 MB. Run this code to specify the folder to save the data in, download the data set from the MathWorks® website, and unzip the folder. After you download the data, the dataFolder folder contains a folder of DICOM files for each scan.
zipFile = matlab.internal.examples.downloadSupportFile("medical", ...
    "CT-PET-Ventilation-Imaging/Chest-CT-PET.zip");
filepath = fileparts(zipFile);
dataFolder = fullfile(filepath,"Chest-CT-PET");

if ~exist(dataFolder)
    unzip(zipFile,filepath)
end
Import Data to Workspace
Load the CT and PET volumes as medicalVolume objects. The medicalVolume object properties contain the image data and key spatial information that the app uses to orient the volume and apply voxel spacing to display world coordinates.
medVolCT = medicalVolume(fullfile(dataFolder,"3.000000-CT Lung  3.0  B31f-00993"));
medVolPET = medicalVolume(fullfile(dataFolder,"4.000000-Galligas Lung-14533"));
Load a medicalVolume object that contains labels of the left and right lung. The label volume is attached to this example as a supporting file. The labels are not part of the original data set. The masks are approximate and have been created for illustrative purposes using the Medical Image Labeler app.
load("medVolLabels.mat")Open Medical Volume Viewer
Open the app from the Apps tab in the MATLAB® Toolstrip, under Image Processing and Computer Vision. A new app session opens with an empty Data Browser.
You can also start the app programmatically by using the medicalVolumeViewer function.
Import Data in App
Load the medicalVolume objects from the workspace.
To load the CT volume with the labels, from the app toolstrip, click Import. Under Labels, select Labels.
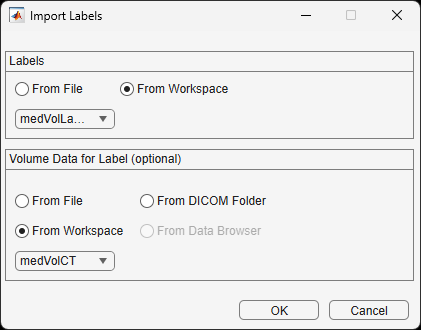
In the Import Labels dialog box, under Labels, select From Workspace and then select
medVolLabelsfrom the dropdown. Under Volume Data for Label, select From Workspace and then selectmedVolCTfrom the drop down. Select OK.
3. To load the PET volume, from the app toolstrip, under Data, select From Workspace. In the dialog box that opens, select medVolPET and click OK.
View Multimodal Overlay
Each volume appears in the Data Browser as a separate entry in Group 1. By default, app displays the first volume and hides the second volume.
Make the labels visible by selecting the eye icon next to medVolLabels_Label. In the app toolstrip, drag the Label Opacity slider to make the labels semitransparent.
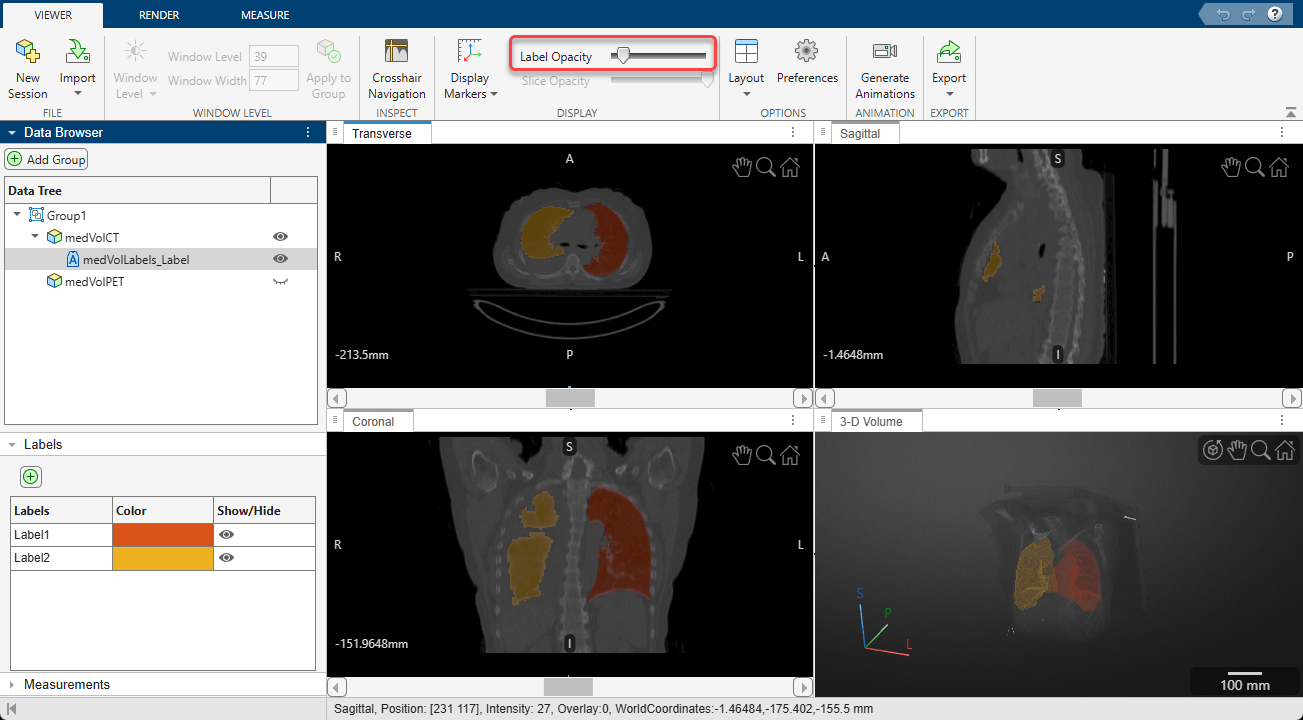
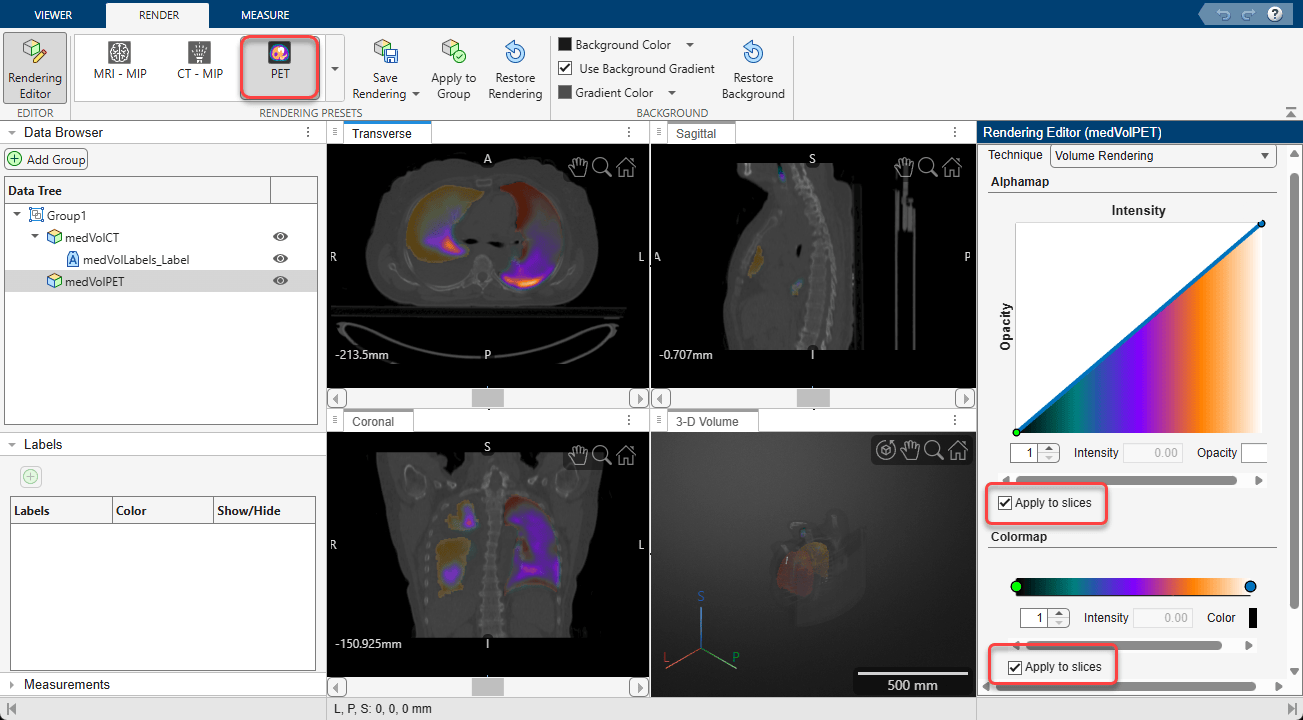
Next, toggle the visibility of the PET volume by clicking the eye icon next to medVolPET in the Data Browser. Initially, you see only the PET slices in the 2-D panes because the black background pixels are fully opaque and cover the CT image. To quickly see the overlay, drag the Slice Opacity slider in the app toolstrip to decrease the opacity of the PET data. Alternatively, to see both volumes clearly, first select the PET volume in the Data Browser. Then, in the Render tab of the app toolstrip, select the PET preset from the Rendering Presets gallery. Click Rendering Editor, and in the editor, under Alphamap and Colormap, select the Apply to Slices boxes. The 2-D slice panes display the PET volume using the selected preset settings, including a linear intensity-opacity curve and colormap designed for viewing PET data. The linear alphamap makes low-value pixels in the background transparent, and high-value pixels more opaque. Both the CT and PET volumes are visible.
Explore Multimodal Overlay
The combination of CT, PET, and segmentation data enables you to view lung ventilation activity in its anatomical context. In this section, explore the relationship among the PET signal, lung anatomy, and segmented lung regions. For a more complete description of the app options and tools, see Get Started with Medical Volume Viewer.
Verify Alignment of CT, PET, and Label Data
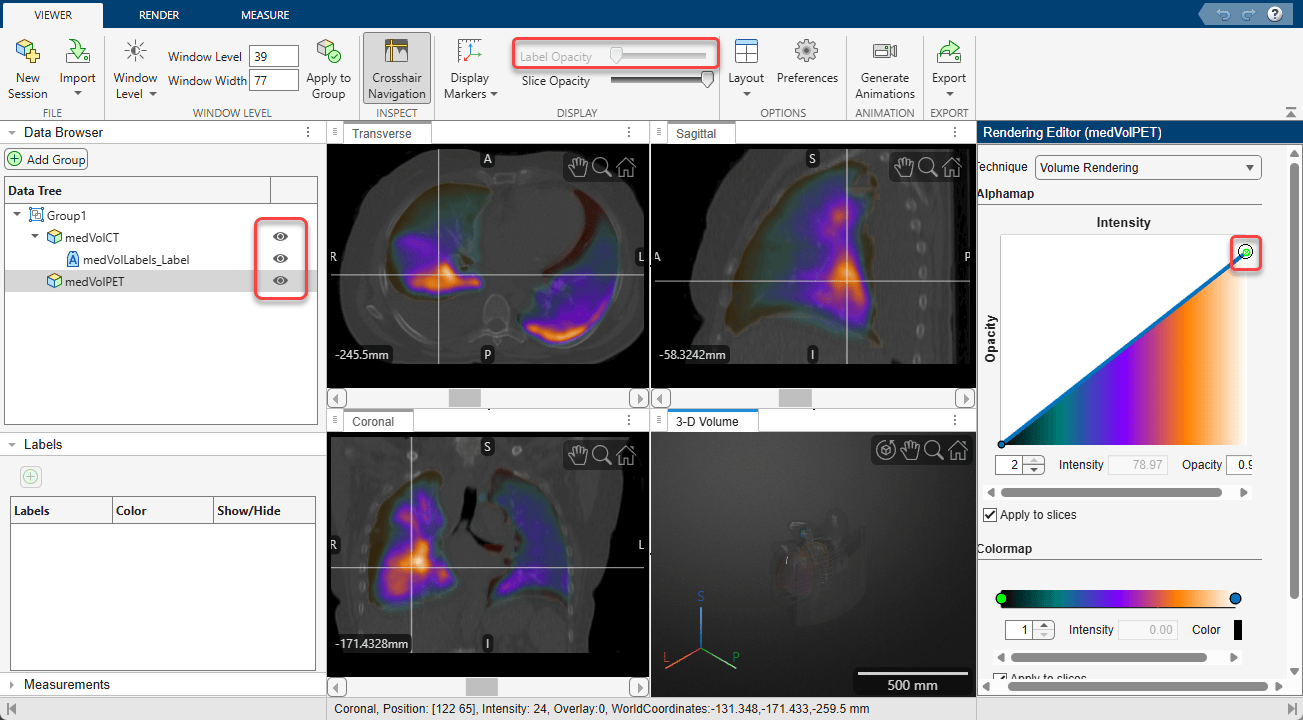
Compare the position of the PET signal relative to the lungs visible in the CT scan and verify that the lung mask covers the intended anatomical regions. The PET activity generally falls within the segmented lung volume, and the boundaries of the lung mask follow the visible lung anatomy.
Scroll through 2-D slices in each pane using the scroll bars, or select Crosshair Navigation from the app toolstrip to synchronize the three slice panes as you explore. To better understand how the datasets relate to one another, selectively show and hide the CT volume, PET volume, and lung mask using the eye icons in the Data Browser. You can adjust the transparency of each volume to focus on particular volumes. To adjust the transparency of the labels, select the label volume in the Data Browser and drag the Label Opacity slider in the Viewer tab of the app toolstrip. To adjust the maximum transparency of the PET volume, select the PET volume in the Data Browser, open the Rendering Editor, and drag the circular slider in the top-right corner of the Intensity-Opacity curve down.
Adjust PET Display to Explore Signal Distribution
You can customize the PET display to emphasize different aspects of the ventilation data. For detailed instructions, see Get Started with Medical Volume Viewer.
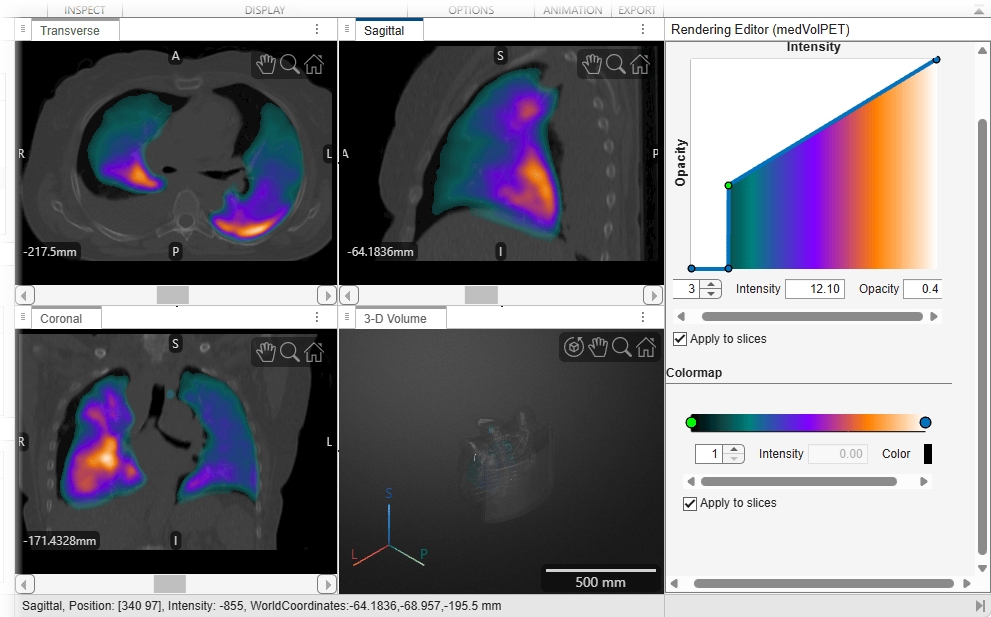
To emphasize specific ranges of PET intensity while still seeing the underlying CT data, customize the alphamap by adjusting the intensity-opacity curve in the Rendering Editor. The intensity-opacity curve maps PET intensity values to opacity, enabling you to control which signal ranges are visible in the overlay. You can add, move, or modify control points on the curve to increase or decrease the opacity of different intensity ranges. For example, this image shows how adding two points at intensity values of 12 and 12.1 creates a sharp transition that de-emphasizes low-intensity background values that can obscure the anatomical detail in the CT. You can add points by clicking the line plot. Change the intensity associated with a slider by dragging it left and right on the plot, or by selecting it and specifying a new value for Intensity. Change the opacity associated with a slider by dragging it up and down on the plot, or by selecting it and specifying a new value for Opacity.
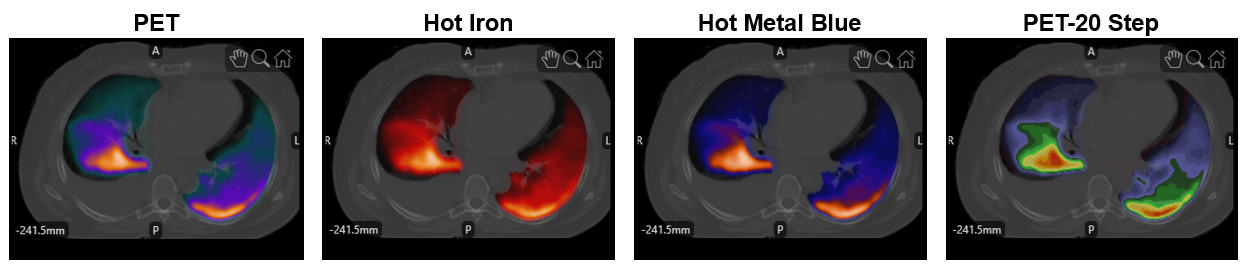
The app also provides several PET-specific colormaps that are commonly used for functional imaging data. To change the colormap, select one of these options from the Rendering Presets gallery in the Render tab of the app toolstrip. This list includes the common use case for each colormap.
PET: Visualize PET uptake over anatomical CT or MRI data.
Hot Iron: Highlight subtle differences in PET signal intensity.
Hot Metal Blue: Enhance contrast between low- and high-uptake regions.
PET – 20 Step: Compare uptake levels using discrete intensity ranges.
This image shows the different colormaps applied to the data in this example, using the default alphamap that each preset uses.
Explore 3-D Volume
The 3-D Volume pane makes it easier to identify large-scale patterns and understand how regions of PET uptake are distributed across the lung volume. Explore the volume using these options:
Drag to rotate the volume about its center.
Zoom using the mouse scroll wheel.
Hold Ctrl while you drag to translate the volume.
Use the toolbar options in the top-right corner of the pane to rotate, pan, zoom, and restore the default view.
Understand the position and size of the volume using the orientation axes and the scale bar.
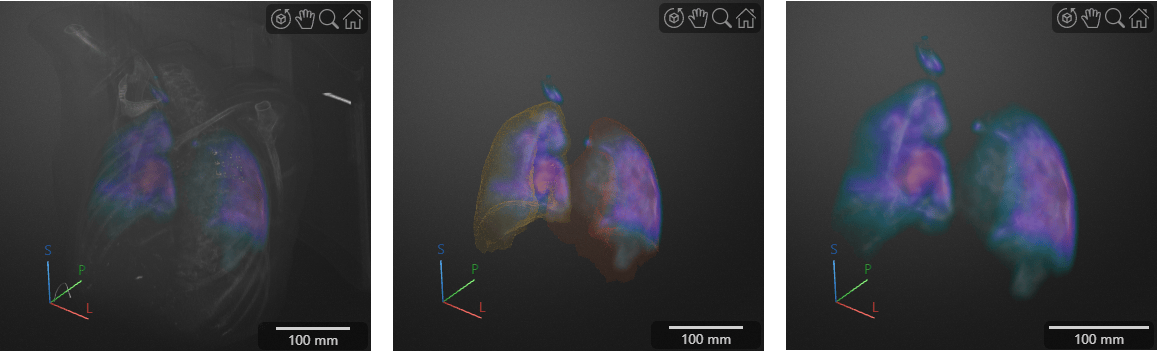
To improve visualization of the PET distribution, customize the 3-D rendering settings. For the CT volume, use the default Gradient Opacity rendering technique, which makes the outside of the volume more transparent and enables you to visualize internal structures including the lungs. You can also decrease the maximum opacity of the CT volume by dragging the maximum point on the intensity-opacity curve downward. For the PET volume, set the rendering technique to Gradient Opacity to visualize the distribution of PET values, or set it to Volume Rendering to more clearly visualize the edges of the PET signal inside the CT.
As you explore the volumes, toggle the visibility of the CT volume or the labels. Displaying the CT volume provides anatomical context and helps relate PET uptake to specific lung regions and surrounding anatomy. Similarly, you can hide the CT volume and display the lung mask to compare the PET distribution directly against the segmented lung regions. View the PET volume alone to best visualize the overall PET distribution, which provides qualitative context such as the highest values are along the posterior wall of both lungs.
This image shows the 3-D Volume display pane with the CT and PET, labels and PET, and PET only.
After you explore the volume, you can perform quantitative measurements using interactive tools, export animations or snapshots, or continue with automated analysis pipelines outside the app. For details about measurement annotations and export options, see Get Started with Medical Volume Viewer.
References
[1] Eslick, Enid M., John Kipritidis, Denis Gradinscak, Mark J. Stevens, Dale L. Bailey, Benjamin Harris, Jeremy T. Booth, and Paul J. Keall. “CT Ventilation as a Functional Imaging Modality for Lung Cancer Radiotherapy (CT-vs-PET-Ventilation-Imaging).” The Cancer Imaging Archive, 2022. https://doi.org/10.7937/3PPX-7S22.
[2] Eslick, Enid M., John Kipritidis, Denis Gradinscak, Mark J. Stevens, Dale L. Bailey, Benjamin Harris, Jeremy T. Booth, and Paul J. Keall. “CT Ventilation Imaging Derived from Breath Hold CT Exhibits Good Regional Accuracy with Galligas PET.” Radiotherapy and Oncology 127, no. 2 (May 2018): 267–73. https://doi.org/10.1016/j.radonc.2017.12.010.
[3] Clark, Kenneth, Bruce Vendt, Kirk Smith, John Freymann, Justin Kirby, Paul Koppel, Stephen Moore, et al. “The Cancer Imaging Archive (TCIA): Maintaining and Operating a Public Information Repository.” Journal of Digital Imaging 26, no. 6 (December 2013): 1045–57. https://doi.org/10.1007/s10278-013-9622-7.
See Also
Medical Volume
Viewer | volshow | medicalVolume

