Get Insights for Tabular Data Using MATLAB Copilot
R2026bUsing MATLAB® Copilot, you can get insights to understand the structure, quality, variable relationships, and patterns in your data. Then, you can generate data analysis code or ask questions about your data.
Get Insights
For tabular data in your workspace, instead of writing exploratory code, you can get insights using MATLAB Copilot to get an overview of the data and decide on next steps.
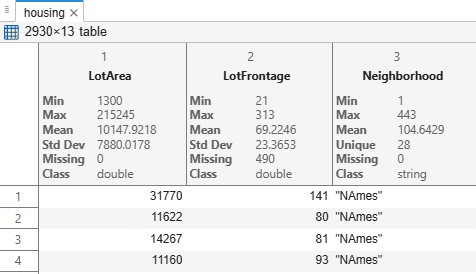
Suppose you want to understand a table of real estate data. The table variables include sale price, square footage, neighborhood, and condition. You might not know which variables matter most or what preprocessing steps the data requires. (The Ames Housing Data in this example is used with permission of the copyright holder. Please contact the copyright holder if you wish to publish or redistribute this data).
You can get insights about a table of data using MATLAB Copilot in two ways:
Workspace panel — Right-click a table or timetable, and select
 Get Insights Using Copilot.
Command Window — Display a table or timetable. Then, below the displayed data, click Get insights using Copilot.
MATLAB Copilot uses two MATLAB functions to understand your data.
Note
A sample of your data is sent to the AI model.
summary— Read the table size, variable types, and metadata, and compute descriptive statistics.corrcoef— Compute the correlation coefficients between numeric variables.
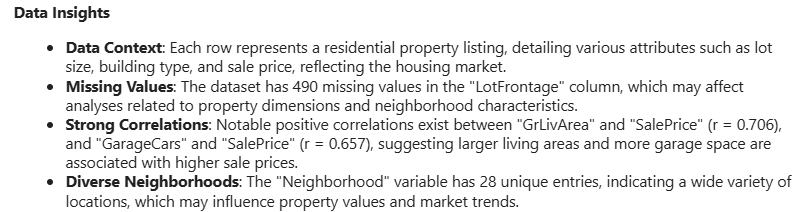
For example, for the real estate data, the insights might reveal that the
LotFrontage variable has many missing values and the
Neighborhood variable has a wide variety of unique values. The insights
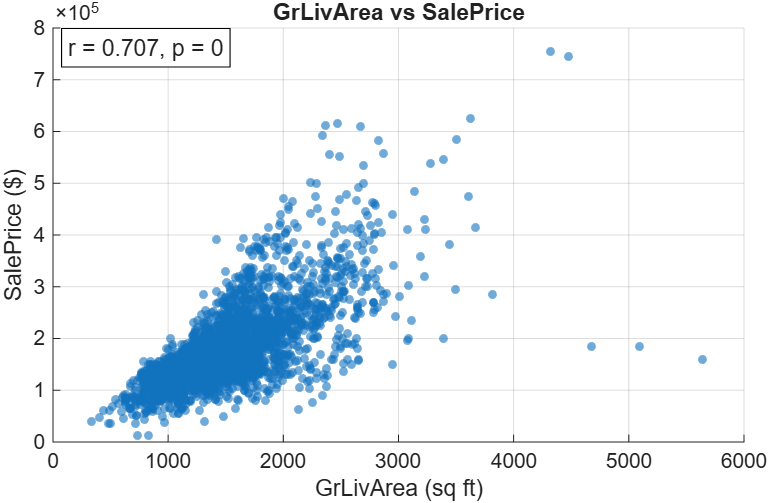
might also reveal there is a notable correlation between the GrLivArea
and GarageCars variables and the SalePrice
variable.
Validate Insights
You can validate the insights generated by MATLAB Copilot before using them in your analysis.
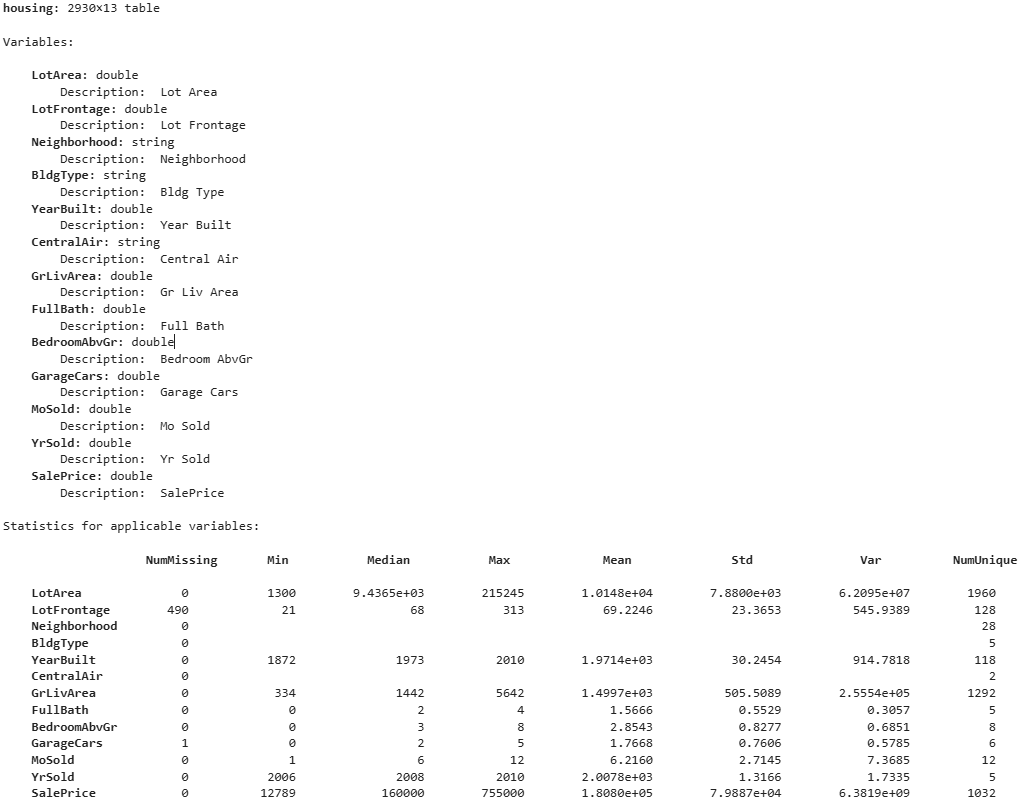
One way to validate the insights is by running the summary and
corrcoef functions yourself and comparing their output against the
insights. To run the block of validation code in the Copilot Chat panel, click
Run Code. Then, review the output in the Command Window. You can
also identify other relevant aspects of your data that were not included in the generated
insights.

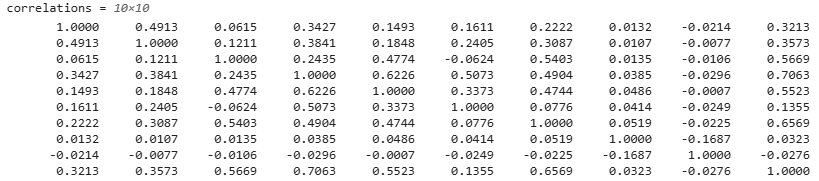
This code labels the correlation coefficients so you can identify which table variables each value corresponds to:
numericVars = housing(:,vartype("float"));
correlations = array2table(correlations,VariableNames=numericVars.Properties.VariableNames,RowNames=numericVars.Properties.VariableNames)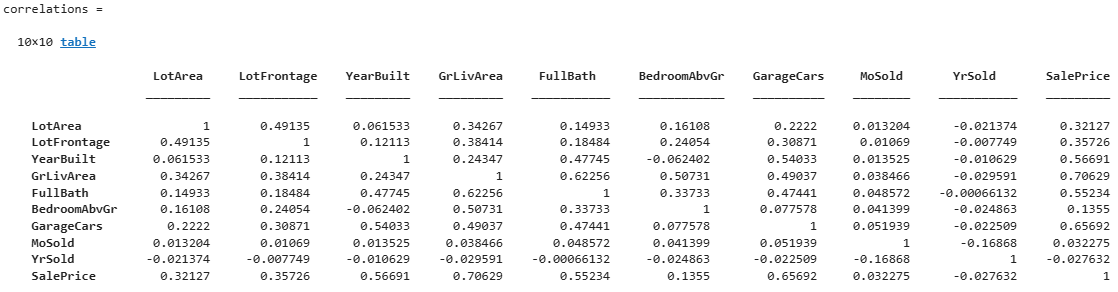
Alternatively, you can open the table in the Variables editor and interactively compute and review summary statistics. Double-click the table in the Workspace panel, and, in the Variables editor, select View > Summary Statistics.
Ask Copilot Questions About Data
Once you have insights into your data, you can continue your analysis by asking MATLAB Copilot questions. You can use the suggested follow-up prompts or type your own questions into the Copilot Chat panel.
Use Follow-Up Prompts
MATLAB Copilot suggests a few follow-up prompts that relate to the insights. You can click these prompts to generate code and suggestions for analyzing the data using MATLAB.
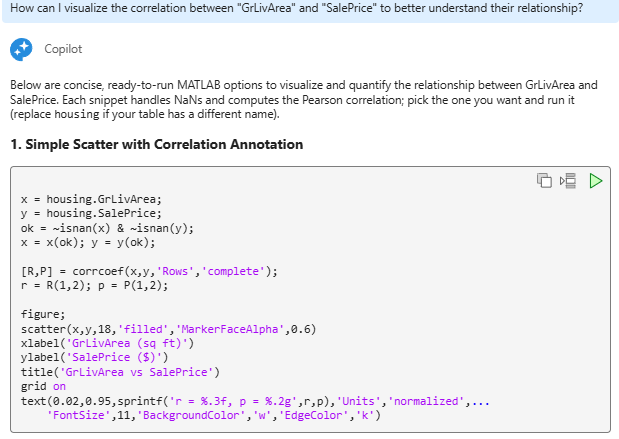
For example, click the prompt that asks MATLAB Copilot to visualize correlated variables. MATLAB Copilot generates code that handles missing values and creates the visualization. You can review this code and then run the code by clicking Run Code in the code block.

Ask Your Own Questions
You can continue exploring your data by typing your own questions into the Copilot Chat panel. MATLAB Copilot uses the insights as context to answer your question.
Tip
When working in the Copilot Chat panel, you can keep the conversation focused by adding files that support your goal as context and removing unrelated files.
For example, in the Copilot Chat, ask What is the average sale
price?
MATLAB Copilot can answer the question directly because it already used the
summary function to compute SalePrice variable
statistics when generating insights. MATLAB Copilot also generates code that computes the mean and median, rather than the
entire set of summary statistics.

You can also ask for suggestions for analyzing the data in MATLAB. For example, in the Copilot Chat, ask How can I compute the
average sale price for each neighborhood?
MATLAB Copilot suggests using the groupsummary function or the
findgroups and splitapply functions.

Get Insights for Another Table
After analyzing a table of data using MATLAB Copilot, save relevant results from your current chat session. For example, save any generated code that you want to preserve. You can also save the entire chat history by selecting the Copy chat history option from the Copilot Chat actions menu at the upper-right corner of the Copilot Chat panel.
Then, get insights for another table using the Workspace panel or Command Window. If the table is unrelated, you can clear the chat history before getting insights by clicking the Clear chat history button.

