Generate Lookup Tables for Equivalent Circuit Battery Block
R2026bThis example shows how to use the characterizeBattery (Model-Based Calibration Toolbox) method to estimate equivalent circuit model lookup table parameters from battery cell test data for the Equivalent Circuit Battery block. Use this workflow when you have transient data, including HPPC test data, and need to parameterize the block for system-level simulation. For example, you can use this approach for electric vehicle powertrain modeling or battery management system (BMS) algorithm development.
Create mbcrunner Object
Create a handle to a CAGE project.
r = mbcrunner;
Open Simulink Model
Open the Simulink model containing the Battery Equivalent Circuit block.
open("ECB.slx");Set the batteryBlock variable to the battery block path.
batteryBlock = "ECB/Battery PTBS Example";Characterize Battery Cell
Characterize the battery using the data files located in the folder HPPC_data/origPreprocessedData. Set the number of iterations for the battery characterization process to 25.
[tbls,sfit] = characterizeBattery( ...
    r,batteryBlock,fullfile(pwd,'HPPC_data','origPreprocessedData'), ...
    NumIterations=25,ShowProgress=false);
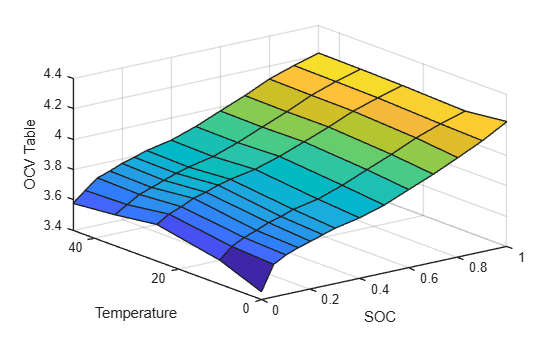
Preview the open circuit voltage table.
surf(SOC_vec,Temperature_vec,tbls.Em');
xlabel('SOC');ylabel('Temperature');zlabel('OCV Table');
Evaluate Feature
Evaluate the Voltage3 feature using the hppcDataBAKcell0degC.mat data file.
[results,s] = evaluateFeature(r,"Voltage3", ...
    fullfile( ...
    pwd,'HPPC_data', 'origPreprocessedData','hppcDataBAKcell0degC.mat'));
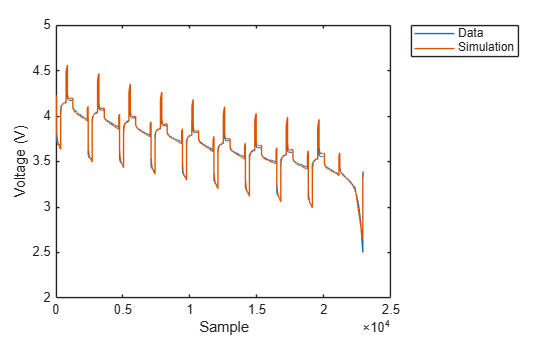
Plot the measured voltage data overlaid with the simulated data.
plot(results.voltage);
hold on
plot(results.Voltage3);
hold off
xlabel('Sample');ylabel('Voltage (V)');
legend('Data','Simulation');
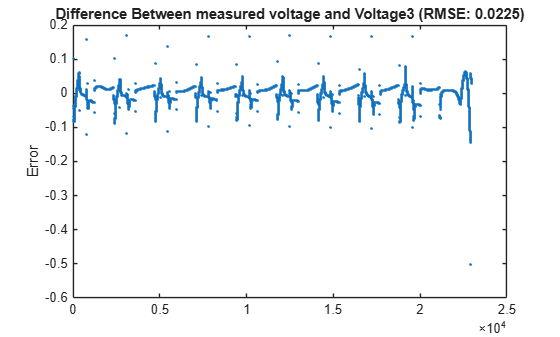
Plot the voltage error to inspect the fit.
plot(results.voltage - results.Voltage3, '.');
ylabel('Error');
title(sprintf('Difference Between measured voltage and Voltage3 (RMSE: %.4f)', s));
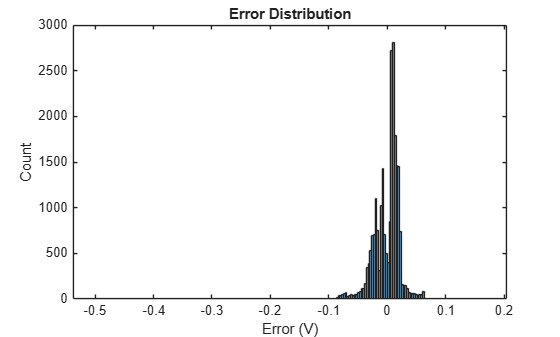
Display the error distribution as a histogram.
histogram(results.voltage - results.Voltage3);
xlabel('Error (V)');ylabel('Count');
title('Error Distribution');
See Also
Calibrate Powertrain Blockset and Simscape Battery Blocks (Model-Based Calibration Toolbox) | Characterize Powertrain Blockset and Simscape Battery Blocks (App) (Model-Based Calibration Toolbox)

