このページの内容は最新ではありません。最新版の英語を参照するには、ここをクリックします。
ECG における R 波検出
この例では、ウェーブレットを使用して心電図 (ECG) 信号を解析する方法を示します。ECG 信号は往々にして非定常であり、その周波数成分は時間とともに変化します。この変化が関心の対象となるイベントです。
ウェーブレットは、信号を時変周波数 (スケール) 成分に分解します。信号の特徴は、ほとんどの場合、時間および周波数に局在化するので、よりスパースな (削減された) 表現で作業するほうが解析および推定が容易です。
QRS 群は、ECG 波形の 3 つの偏位で構成されます。QRS 群は、左右の心室の脱分極を反映するもので、人間の ECG の最も顕著な特徴です。
ECG 波形を読み込み、プロットします。この波形は、2 人以上の心臓専門医によって、QRS 群の R ピークに注釈が付けられています。ECG データと注釈は、MIT-BIH Arrhythmia Database から取得されたものです。データは 360 Hz でサンプリングされています。
load mit200
figure
plot(tm,ecgsig)
hold on
plot(tm(ann),ecgsig(ann),'ro')
xlabel('Seconds')
ylabel('Amplitude')
title('Subject - MIT-BIH 200')

ウェーブレットを使用して、R-R 間隔推定などのアプリケーションに使用する自動 QRS 検出器を構築できます。
ウェーブレットを一般的な特徴検出器として使用する場合、重要な点が 2 つあります。
ウェーブレット変換は信号成分を異なる周波数帯域に分離するので、よりスパースな信号の表現を実現できます。
ほとんどの場合、検出しようとしている特徴に似たウェーブレットを見つけることができます。
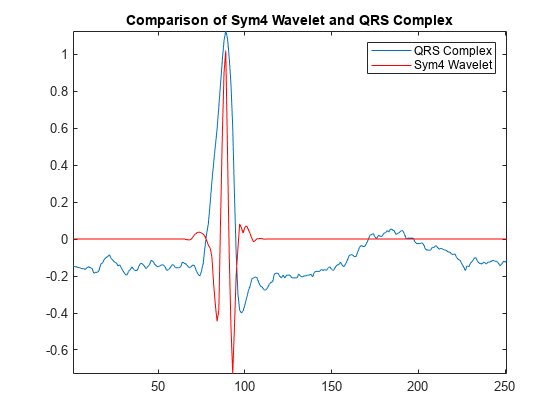
'sym4' ウェーブレットは QRS 群に似ているので、QRS 検出に適しています。これを明確に示すため、QRS 群を抽出し、その結果を膨張および平行移動した 'sym4' ウェーブレットとともにプロットして比較します。
qrsEx = ecgsig(4560:4810);
fb = dwtfilterbank('Wavelet','sym4','SignalLength',numel(qrsEx),'Level',3);
psi = wavelets(fb);
figure
plot(qrsEx)
hold on
plot(-2*circshift(psi(3,:),[0 -38]),'r')
axis tight
legend('QRS Complex','Sym4 Wavelet')
title('Comparison of Sym4 Wavelet and QRS Complex')
hold off
最大重複離散ウェーブレット変換 (MODWT) を使用して、ECG 波形内の R ピークを強調します。MODWT は非間引き離散ウェーブレット変換で、任意のサンプル サイズを処理します。
まず、既定の 'sym4' ウェーブレットを使用して、レベル 5 まで ECG 波形を分解します。次に、スケール 4 および 5 のウェーブレット係数のみを使用して、周波数局在型のバージョンの ECG 波形を再構築します。これらのスケールは、次の近似周波数帯域に対応します。
スケール 4 -- [11.25, 22.5) Hz
スケール 5 -- [5.625, 11.25) Hz
これは上記の通過帯域をカバーし、QRS エネルギーを最大化します。
wt = modwt(ecgsig,5);
wtrec = zeros(size(wt));
wtrec(4:5,:) = wt(4:5,:);
y = imodwt(wtrec,'sym4');
ウェーブレット係数から構築した信号 Approximation の絶対値の 2 乗を使用し、ピーク検出アルゴリズムを利用して R ピークを特定します。
Signal Processing Toolbox™ がある場合、findpeaks を使用してピークの位置を特定できます。ウェーブレット変換を使用して取得した R ピーク波形をプロットし、自動検出したピークの位置で注釈を付けます。
y = abs(y).^2;
[qrspeaks,locs] = findpeaks(y,tm,'MinPeakHeight',0.35,...
    'MinPeakDistance',0.150);
figure
plot(tm,y)
hold on
plot(locs,qrspeaks,'ro')
xlabel('Seconds')
title('R Peaks Localized by Wavelet Transform with Automatic Annotations')

R ピーク波形に専門家の注釈を追加します。自動ピーク検出の時間は、本当のピークの 150 msec 以内 ( msec) であれば正確と考えられます。
plot(tm(ann),y(ann),'k*')
title('R peaks Localized by Wavelet Transform with Expert Annotations')

コマンド ラインで、tm(ann) および locs の値を比較できます。これらは、それぞれ専門家による時間と自動ピーク検出の時間です。ウェーブレット変換を使用して R ピークを強調した結果、ヒット率は 100%、誤検知はなしとなっています。ウェーブレット変換を使用して計算した心拍数は 88.60 bpm (1 分あたりの回数) です。これに対して、注釈付き波形では 88.72 bpm です。
元のデータの振幅の 2 乗で処理してみると、R ピークを分離するウェーブレット変換の機能によって検出の問題がかなり容易になることがわかります。生データで処理すると、10.4 秒のあたりで S 波のピークの 2 乗が R 波のピークを上回るときなど、誤認が生じる可能性があります。
figure
plot(tm,ecgsig,'k--')
hold on
plot(tm,y,'r','linewidth',1.5)
plot(tm,abs(ecgsig).^2,'b')
plot(tm(ann),ecgsig(ann),'ro','markerfacecolor',[1 0 0])
set(gca,'xlim',[10.2 12])
legend('Raw Data','Wavelet Reconstruction','Raw Data Squared', ...
    'Location','SouthEast');
xlabel('Seconds')

生データの振幅の 2 乗に findpeaks を使用すると、12 の誤検知が発生します。
[qrspeaks,locs] = findpeaks(ecgsig.^2,tm,'MinPeakHeight',0.35,...
    'MinPeakDistance',0.150);
R ピークの極性の切り替わりに加え、ECG は頻繁にノイズによって破損します。
load mit203
figure
plot(tm,ecgsig)
hold on
plot(tm(ann),ecgsig(ann),'ro')
xlabel('Seconds')
ylabel('Amplitude')
title('Subject - MIT-BIH 203 with Expert Annotations')

MODWT を使用して R ピークを分離します。findpeaks を使用してピークの位置を特定します。R ピーク波形を、専門家の注釈および自動注釈とともにプロットします。
wt = modwt(ecgsig,5);
wtrec = zeros(size(wt));
wtrec(4:5,:) = wt(4:5,:);
y = imodwt(wtrec,'sym4');
y = abs(y).^2;
[qrspeaks,locs] = findpeaks(y,tm,'MinPeakHeight',0.1,...
    'MinPeakDistance',0.150);
figure
plot(tm,y)
title('R-Waves Localized by Wavelet Transform')
hold on
hwav = plot(locs,qrspeaks,'ro');
hexp = plot(tm(ann),y(ann),'k*');
xlabel('Seconds')
legend([hwav hexp],'Automatic','Expert','Location','NorthEast');

ヒット率は再び 100% となり、偽警報 は 0 です。
前の例では、modwt から構築した信号 Approximation に基づいて、非常にシンプルなウェーブレット QRS 検出器を使用しました。その目的は信号成分を分離するウェーブレット変換の機能を示すことであり、最もロバストなウェーブレット変換ベースの QRS 検出器の構築を目指したものではありません。たとえば、ウェーブレット変換が信号のマルチスケール解析を提供するという事実を利用して、ピーク検出を強化できます。
参考文献
Goldberger A. L., L. A. N. Amaral, L. Glass, J. M. Hausdorff, P. Ch. Ivanov, R. G. Mark, J. E. Mietus, G. B. Moody, C-K Peng, H. E. Stanley."PhysioBank, PhysioToolkit, and PhysioNet: Components of a New Research Resource for Complex Physiologic Signals." Circulation 101.Vol.23, e215-e220, 2000. http://circ.ahajournals.org/cgi/content/full/101/23/e215
Moody, G. B."Evaluating ECG Analyzers". http://www.physionet.org/physiotools/wfdb/doc/wag-src/eval0.tex
Moody G. B., R. G. Mark."The impact of the MIT-BIH Arrhythmia Database." IEEE Eng in Med and Biol.Vol. 20, Number 3, 2001), pp. 45-50 .
関連するトピック
You can also select a web site from the following list:
Americas
- América Latina (Español)
- Canada (English)
- United States (English)
Europe
- Belgium (English)
- Denmark (English)
- Deutschland (Deutsch)
- España (Español)
- Finland (English)
- France (Français)
- Ireland (English)
- Italia (Italiano)
- Luxembourg (English)
- Netherlands (English)
- Norway (English)
- Österreich (Deutsch)
- Portugal (English)
- Sweden (English)
- Switzerland
- United Kingdom (English)