このページの内容は最新ではありません。最新版の英語を参照するには、ここをクリックします。
離散ウェーブレット解析
Wavelet Toolbox™ ソフトウェアを使用すると、大きくサンプリングされている直交および双直交の離散ウェーブレット解析を使用して信号、イメージ、および 3 次元データを解析できます。大きくサンプリングされている離散ウェーブレット解析は、"間引きあり" の離散ウェーブレット解析としても知られています。間引きありの離散ウェーブレット解析は、データの圧縮、ノイズ除去、および特定のクラスの信号およびイメージのスパース表現に最も適しています。
間引きありの離散ウェーブレット解析では、スケールと平行移動は 2 進です。
1 次元ウェーブレットのノイズ除去
この例では、離散ウェーブレット解析を使用して信号からノイズを除去する方法を示します。
基準信号を作成します。
len = 2^11;
h = [4  -5  3  -4  5  -4.2   2.1   4.3  -3.1   5.1  -4.2];
t = [0.1  0.13  0.15  0.23  0.25  0.40  0.44  0.65  0.76  0.78  0.81];
h  = abs(h);
w  = 0.01*[0.5 0.5 0.6 1 1 3 1 1 0.5 0.8 0.5];
tt = linspace(0,1,len);
xref = zeros(1,len);
for j=1:11
    xref = xref+(h(j)./(1+((tt-t(j))/w(j)).^4));
end
分散 0.25 でゼロ平均のホワイト ガウス ノイズを付加します。
rng default
x = xref + 0.5*randn(size(xref));
plot(tt,x)
axis tight
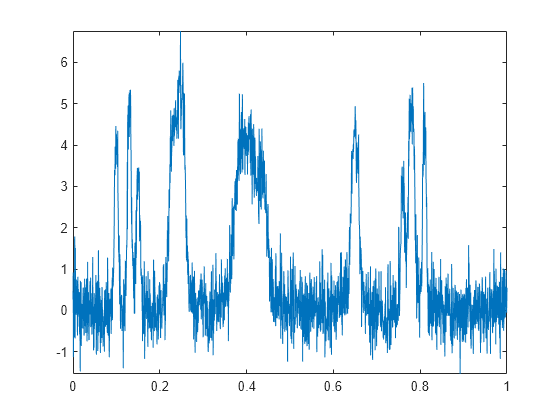
4 つの消失モーメントを持つ Daubechies 最小非対称ウェーブレットを使用し、レベル 3 まで下げて信号ノイズを除去します。Donoho および Johnstone のユニバーサルなしきい値選択ルールと、レベル 1 の DWT 係数に基づくソフトなしきい値処理を使用します。周期化信号拡張モード — dwtmode('per') を使用します。比較のため、結果を基準信号と共にプロットします。
origmode = dwtmode('status','nodisplay');
dwtmode('per','nodisplay')
xd = wdenoise(x,3,'Wavelet','sym4', ...
    'DenoisingMethod','UniversalThreshold','NoiseEstimate','LevelIndependent');
plot(tt,xd)
axis tight
hold on
plot(tt,xref,'r')
hold off
legend('Denoised','Reference')

拡張モードを元に戻します。
dwtmode(origmode,'nodisplay')間引きありの 2 次元離散ウェーブレット解析
この例では、入力したイメージの 2 次元 DWT を求める方法を示します。
イメージを読み込んで表示します。イメージは、垂直パターン、水平パターン、および対角パターンで構成されます。
load tartan
imagesc(X)
colormap(gray)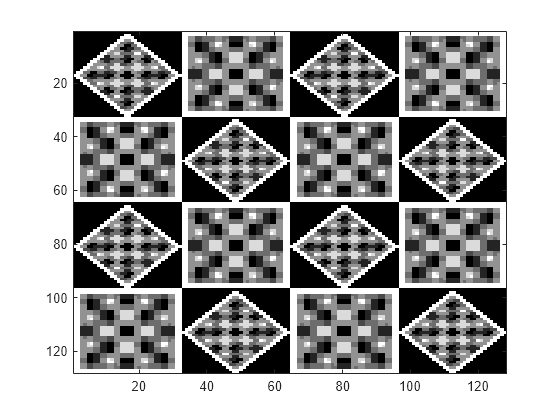
双直交 B スプライン ウェーブレットと、解析フィルターに 2 つの消失モーメントと合成フィルターに 4 つの消失モーメントを持つスケーリング フィルターを使用して、レベル 1 の 2 次元 DWT を求めます。
[C,S] = wavedec2(X,1,'bior2.4');水平、垂直、および対角のウェーブレット係数と Approximation 係数を抽出します。
[H,V,D] = detcoef2('all',C,S,1);
A = appcoef2(C,S,'bior2.4');
結果を表示します。
tiledlayout(2,2)
nexttile
imagesc(A)
title('Approximation Level 1')
colormap(gray)
nexttile
imagesc(H)
title('Horizontal Details')
nexttile
imagesc(V)
title('Vertical Details')
nexttile
imagesc(D)
title('Diagonal Details')
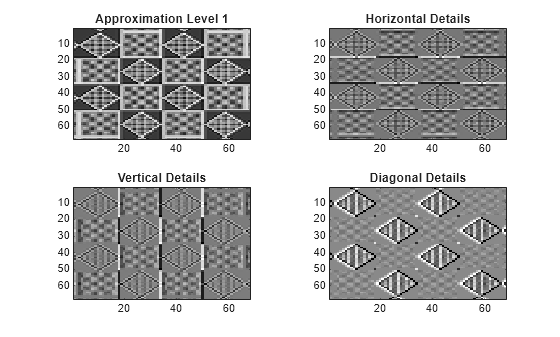
ウェーブレットの Detail は、入力イメージの特定の方向に敏感に反応することがわかります。Approximation 係数は、元のイメージに対するローパス Approximation です。
間引きなしの離散ウェーブレット解析
この例では、ノイズを含む周波数変調信号の間引きなしの (定常) ウェーブレット変換を求める方法を示します。
ノイズを含む Doppler 信号を読み込み、レベル 4 まで下げて定常ウェーブレット変換を求めます。
load noisdopp
swc = swt(noisdopp,4,'sym8');
元の信号と、レベル 1 およびレベル 3 のウェーブレット係数をプロットします。レベル 4 の Approximation をプロットします。
tiledlayout('vertical')
nexttile
plot(noisdopp)
axis tight
nexttile
plot(swc(1,:))
axis tight
ylabel('D1')
set(gca,'ytick',[])
nexttile
plot(swc(3,:))
axis tight
ylabel('D3')
set(gca,'ytick',[])
nexttile
plot(swc(5,:))
axis tight
ylabel('A4')
set(gca,'ytick',[])

ウェーブレットと各レベルの Approximation 係数は、入力信号の長さと等しくなります。加法性ノイズは、レベル 1 の Detail 係数にほとんど局在化しています。レベル 3 の Detail 係数は、Doppler 信号の最初の高周波振動を捉えています。レベル 4 の Approximation 係数は、Doppler 信号に対するローパス Approximation です。
イメージの間引きなしの 2 次元ウェーブレット変換を求めます。Daubechies 最小非対称ウェーブレット sym4 を使用し、レベル 3 まで下げて多重解像度解析を求めます。イメージを読み込みます。wcodemat を使用して、表示用に行列をスケーリングします。
load tartan
nbcol = size(map,1);
cod_X = wcodemat(X,nbcol);
間引きなしの多重解像度解析をレベル 3 まで下げて求めます。
[ca,chd,cvd,cdd] = swt2(X,3,'sym4');元のイメージと各レベルの Approximation 係数および Detail 係数を表示します。
tiledlayout(2,2)
nexttile
image(cod_X)
title('Original Image')
colormap(map)

for k = 1:3
    cod_ca  = wcodemat(ca(:,:,k),nbcol);
    cod_chd = wcodemat(chd(:,:,k),nbcol);
    cod_cvd = wcodemat(cvd(:,:,k),nbcol);
    cod_cdd = wcodemat(cdd(:,:,k),nbcol);
    decl = [cod_ca,cod_chd;cod_cvd,cod_cdd];

    nexttile
    image(decl)

    title(['SWT: Approx. ', ...
        'and Det. Coefs (Lev. ',num2str(k),')'])
    colormap(gray)
end

参考
アプリ
関数
オブジェクト
関連する例
詳細
You can also select a web site from the following list:
Americas
- América Latina (Español)
- Canada (English)
- United States (English)
Europe
- Belgium (English)
- Denmark (English)
- Deutschland (Deutsch)
- España (Español)
- Finland (English)
- France (Français)
- Ireland (English)
- Italia (Italiano)
- Luxembourg (English)
- Netherlands (English)
- Norway (English)
- Österreich (Deutsch)
- Portugal (English)
- Sweden (English)
- Switzerland
- United Kingdom (English)