このページの内容は最新ではありません。最新版の英語を参照するには、ここをクリックします。
解析信号とヒルベルト変換
関数 hilbert は、有限データ ブロックに正確に一致する解析信号を検出します。また、有限インパルス応答 (FIR) ヒルベルト変換フィルターを使用して解析信号を生成し、虚数部に対する近似を計算することもできます。
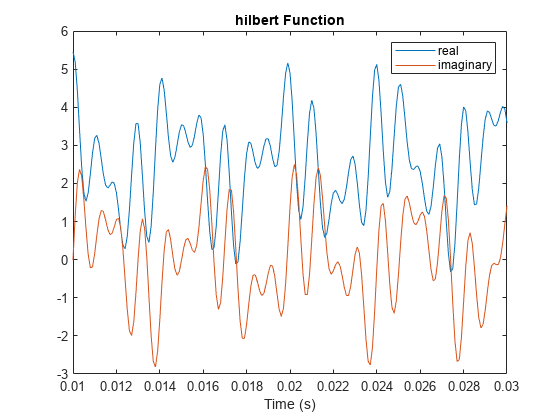
周波数が 203 Hz、721 Hz および 1001 Hz である 3 つの正弦波で構成されるシーケンスを生成します。シーケンスは 10 kHz で約 1 秒間サンプリングされています。関数 hilbert を使用して解析信号を計算します。これを 0.01 秒と 0.03 秒の間でプロットします。
fs = 1e4;
t = 0:1/fs:1;

x = 2.5 + cos(2*pi*203*t) + sin(2*pi*721*t) + cos(2*pi*1001*t);

y = hilbert(x);

plot(t,real(y),t,imag(y))
xlim([0.01 0.03])
legend('real','imaginary')
title('hilbert Function')
xlabel('Time (s)')
元のシーケンスおよび解析信号のパワー スペクトル密度のウェルチ推定を計算します。ハミング ウィンドウを適用した長さ 256 のオーバーラップのないセクションにシーケンスを分割します。負の周波数では解析信号にパワーがないことを確認します。
pwelch([x;y].',256,0,[],fs,'centered')
legend('Original','hilbert')

関数 designfilt を使用して 60 次のヒルベルト変換器 FIR フィルターを設計します。400 Hz の遷移幅を指定します。フィルターの周波数応答を可視化します。
fo = 60;

d = designfilt('hilbertfir','FilterOrder',fo, ...
       'TransitionWidth',400,'SampleRate',fs);

freqz(d,1024,fs)

正弦波シーケンスをフィルター処理し、解析信号の虚数部を近似します。
hb = filter(d,x);
フィルターの群遅延 grd はフィルターの次数の 1/2 と等価です。この遅延を補正します。虚数部の最初の grd サンプルと実数部の最後の grd サンプルおよび時間ベクトルを削除します。0.01 秒と 0.03 秒の間の結果をプロットします。
grd = fo/2;

y2 = x(1:end-grd) + 1j*hb(grd+1:end);
t2 = t(1:end-grd);

plot(t2,real(y2),t2,imag(y2))
xlim([0.01 0.03])
legend('real','imaginary')
title('FIR Filter')
xlabel('Time (s)')

近似の解析信号のパワー スペクトル密度 (PSD) を推定し、hilbert の結果と比較します。
pwelch([y;[y2 zeros(1,grd)]].',256,0,[],fs,'centered')
legend('hilbert','FIR Filter')

参考
You can also select a web site from the following list:
Americas
- América Latina (Español)
- Canada (English)
- United States (English)
Europe
- Belgium (English)
- Denmark (English)
- Deutschland (Deutsch)
- España (Español)
- Finland (English)
- France (Français)
- Ireland (English)
- Italia (Italiano)
- Luxembourg (English)
- Netherlands (English)
- Norway (English)
- Österreich (Deutsch)
- Portugal (English)
- Sweden (English)
- Switzerland
- United Kingdom (English)