このページの内容は最新ではありません。最新版の英語を参照するには、ここをクリックします。
findsignal
類似性検索を使用した信号の位置の検出
構文
説明
[ は、検索配列 istart,istop,dist] = findsignal(data,signal)signal と最もよく一致するデータ配列 data の開始と終了のインデックスを返します。最もよく一致するセグメントは、dist (セグメントと検索配列の間のユークリッド距離の二乗) が最小のものです。data と signal が行列の場合、findsignal によって、signal に最もよく一致する data の開始と終了の列が検出されます。その場合、data と signal の行数は同じでなければなりません。
[ は、名前と値の組の引数を使用して追加オプションを指定します。オプションには、適用する正規化、レポートされるセグメント数、使用する距離計量などがあります。istart,istop,dist] = findsignal(data,signal,Name,Value)
例
データ内の信号の検出
0.5 秒間 1 kHz のサンプル レートで、50% の帯域幅をもち 5 Hz のガウス パルスで構成されるデータ セットを生成します。
fs = 1e3;

t = 0:1/fs:0.5;
data = gauspuls(t,5,0.5);
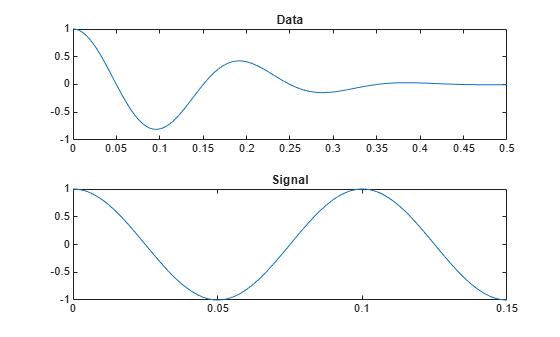
10 Hz の正弦波の 1.5 サイクルで構成される信号を生成します。データ セットと信号をプロットします。
ts = 0:1/fs:0.15;
signal = cos(2*pi*10*ts);

subplot(2,1,1)
plot(t,data)
title('Data')
subplot(2,1,2)
plot(ts,signal)
title('Signal')
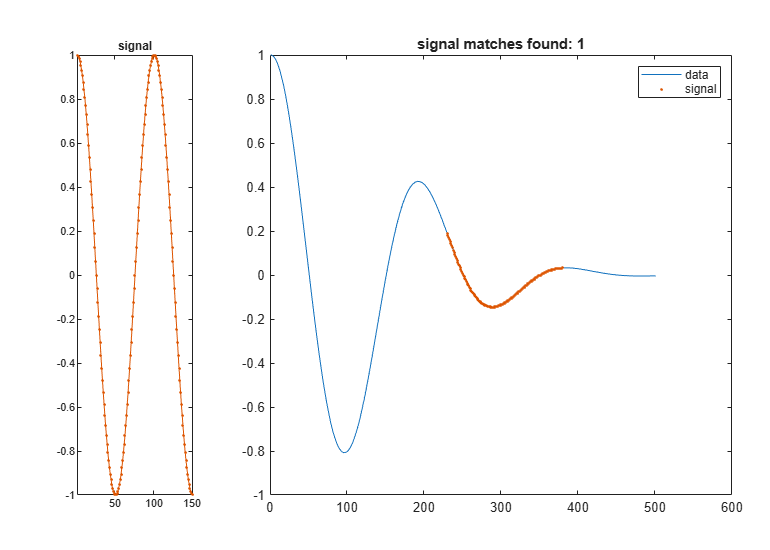
信号へのユークリッド距離の二乗が最小となるデータのセグメントを検出します。データをプロットし、セグメントを強調表示します。
figure
findsignal(data,signal)
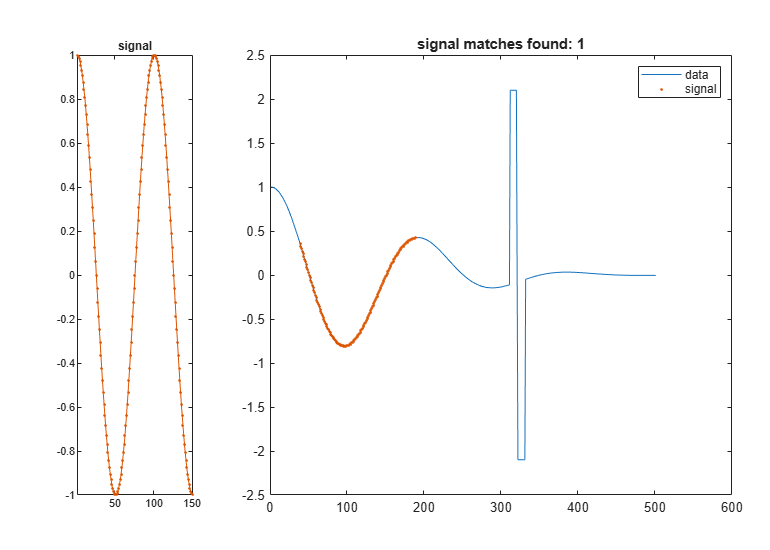
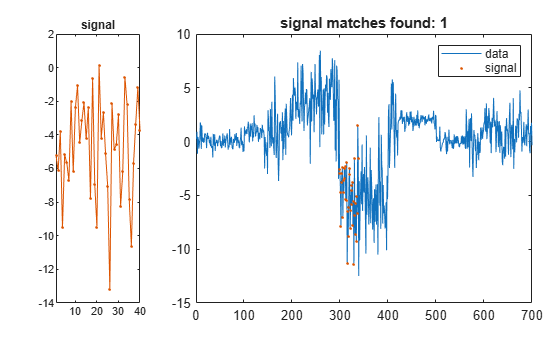
明らかに値が外れている 2 つのセクションをデータ セットに追加します。最小の絶対距離という観点で信号に最も近いセグメントを検出します。
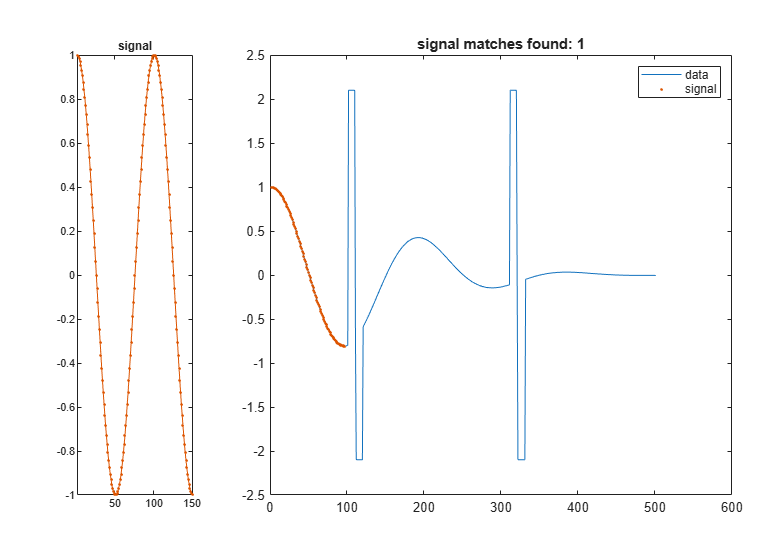
dt = data;
dt(t>0.31&t<0.32) = 2.1;
dt(t>0.32&t<0.33) = -2.1;

findsignal(dt,signal,'Metric','absolute')
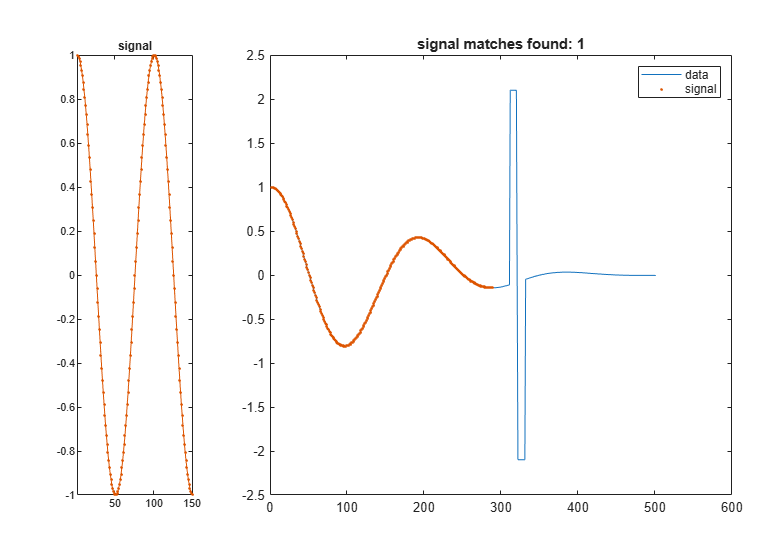
引き伸ばしにより最も近いデータ セグメントと信号との間の距離の絶対値がより小さくなる場合、x 軸を引き延ばします。
findsignal(dt,signal,'TimeAlignment','dtw','Metric','absolute')
値が外れている 2 つのセクションをさらにデータ セットに追加します。
dt(t>0.1&t<0.11) = 2.1;
dt(t>0.11&t<0.12) = -2.1;

findsignal(dt,signal,'TimeAlignment','dtw','Metric','absolute')
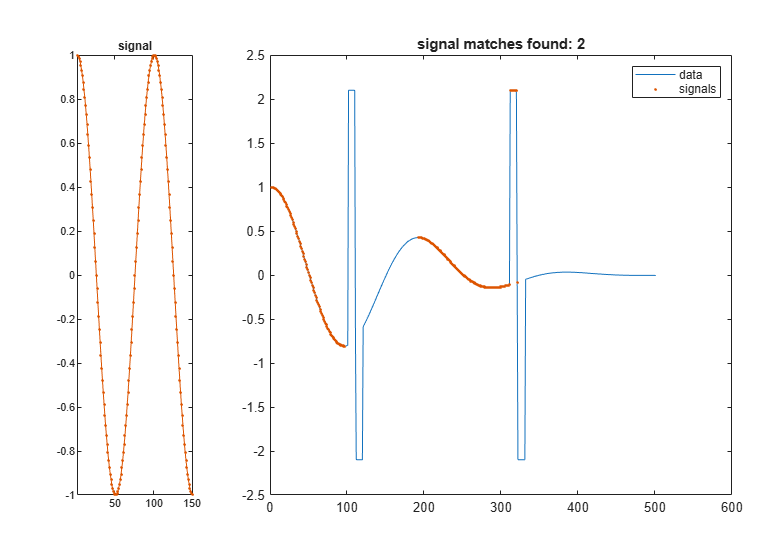
信号に最も近い 2 つのデータ セグメントを検索します。
findsignal(dt,signal,'TimeAlignment','dtw','Metric','absolute', ...
    'MaxNumSegments',2)
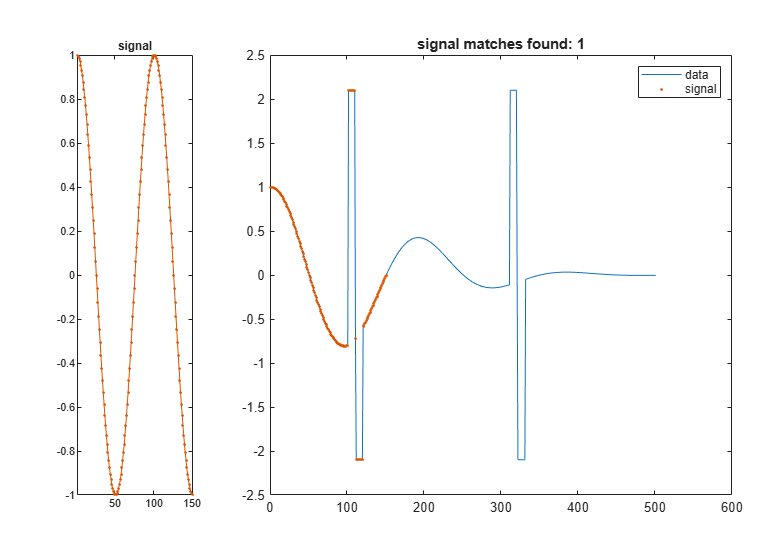
1 つのセグメントの検索に戻ります。'edr' を x 軸の引き伸ばしの基準として選択します。編集距離の許容誤差に 3 を選択します。一致しないサンプル間の編集距離は、実際の距離の影響を受けないため、'edr' は外れ値に対してロバストになります。
findsignal(dt,signal,'TimeAlignment','edr','EDRTolerance',3, ...
    'Metric','absolute')
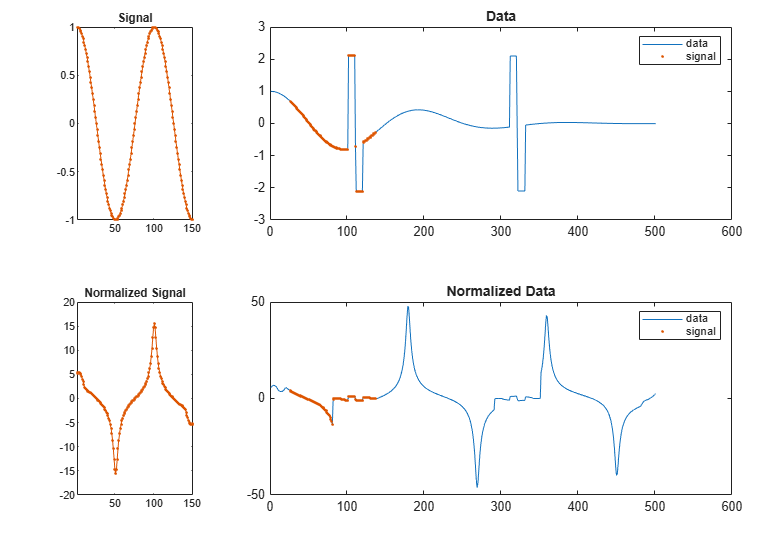
計算を繰り返します。ただし、今度はデータと信号を正規化します。
各データおよび信号点のいずれかの側に 10 サンプルの移動ウィンドウを定義します。
ウィンドウ内のデータの平均で減算し、局所標準偏差で除算します。
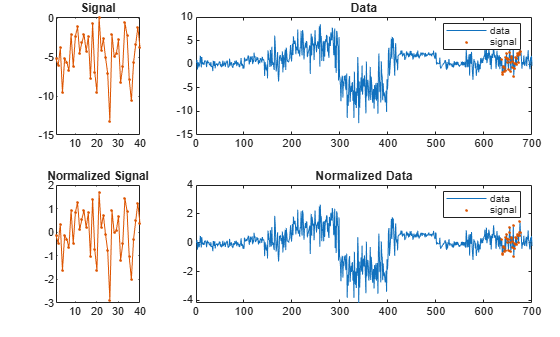
正規化された信号への絶対距離が最小となる正規化されたデータ セグメントを検出します。正規化されていないデータと信号、および正規化されたデータと信号を表示します。
findsignal(dt,signal,'TimeAlignment','edr','EDRTolerance',3, ...
    'Normalization','zscore','NormalizationLength',21, ...
    'Metric','absolute','Annotate','all')
急激な変化を伴うデータでの信号の検出
次の条件でランダムなデータ配列を生成します。
平均値は 7 つの各領域内では一定だが、領域から領域にかけて急激に変化する。
標準偏差は、5 つの各領域内で一定であり、領域から領域にかけて急激に変化する。
lr = 20;

mns = [0 1 4 -5 2 0 1];
nm = length(mns);

vrs = [1 4 6 1 3]/2;
nv = length(vrs);

v = randn(1,lr*nm*nv);

f = reshape(repmat(mns,lr*nv,1),1,lr*nm*nv);
y = reshape(repmat(vrs,lr*nm,1),1,lr*nm*nv);

t = v.*y+f;
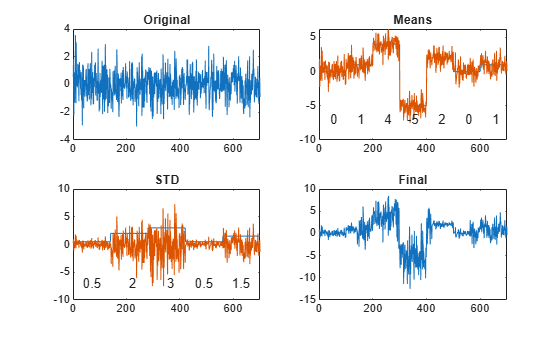
作成の手順を強調しながらデータをプロットします。各領域の平均値と標準偏差を表示します。
subplot(2,2,1)
plot(v)
title('Original')
xlim([0 700])

subplot(2,2,2)
plot([f;v+f]')
title('Means')
xlim([0 700])
text(lr*nv*nm*((0:1/nm:1-1/nm)+1/(2*nm)),-7*ones(1,nm),num2str(mns'), ...
    'HorizontalAlignment',"center")

subplot(2,2,3)
plot([y;v.*y]')
title('STD')
xlim([0 700])
text(lr*nv*nm*((0:1/nv:1-1/nv)+1/(2*nv)),-7*ones(1,nv),num2str(vrs'), ...
    'HorizontalAlignment',"center")

subplot(2,2,4)
plot(t)
title('Final')
xlim([0 700])
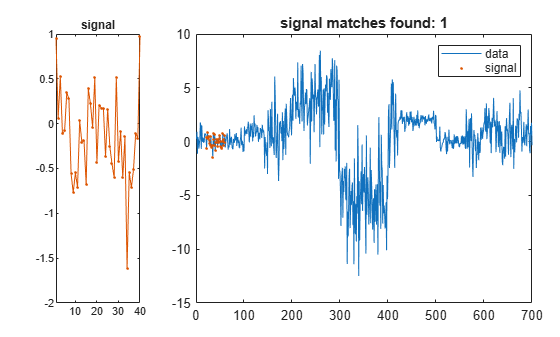
平均値 0 と標準偏差 1/2 のランダムな信号を作成します。信号に最もよく一致するデータ配列のセグメントを検出および表示します。
sg = randn(1,2*lr)/2;

findsignal(t,sg)
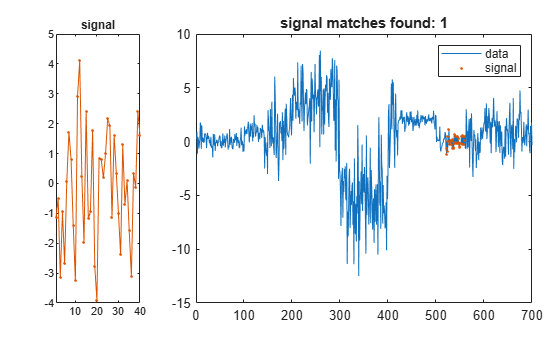
平均値 0 と標準偏差 2 のランダムな信号を作成します。信号に最もよく一致するデータ配列のセグメントを検出および表示します。
sg = randn(1,2*lr)*2;

findsignal(t,sg)
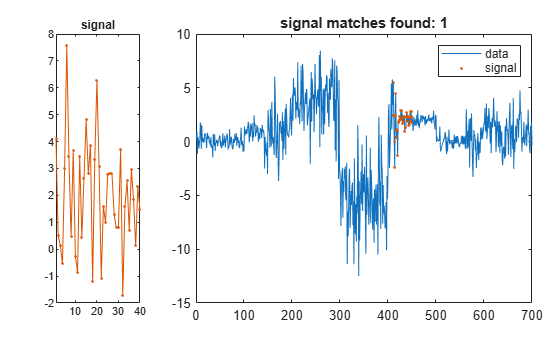
平均値 2 と標準偏差 2 のランダムな信号を作成します。信号に最もよく一致するデータ配列のセグメントを検出および表示します。
sg = randn(1,2*lr)*2+2;

findsignal(t,sg)
平均値 -4 と標準偏差 3 のランダムな信号を作成します。信号に最もよく一致するデータ配列のセグメントを検出および表示します。
sg = randn(1,2*lr)*3-4;

findsignal(t,sg)
計算を繰り返します。ただし、今度は信号とデータの両方から平均値を減算します。
findsignal(t,sg,'Normalization','zscore','Annotate','all')
書体サンプル内の文字の検出
初期のコンピューターの出力に似た書体を考案します。それを使用して MATLAB® という単語を書きます。
rng default
chr = @(x)dec2bin(x')-48;
M = chr([34 34 54 42 34 34 34]);
A = chr([08 20 34 34 62 34 34]);
T = chr([62 08 08 08 08 08 08]);
L = chr([32 32 32 32 32 32 62]);
B = chr([60 34 34 60 34 34 60]);
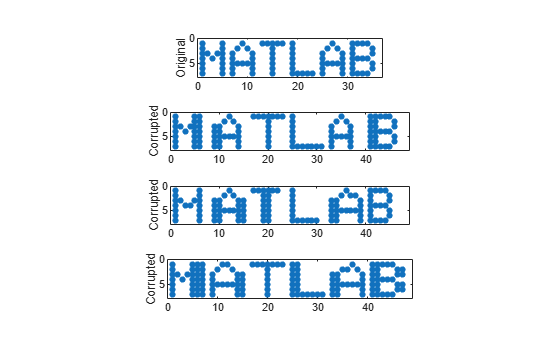
MATLAB = [M A T L A B];ランダムな文字の列を繰り返し、間隔を変えて単語を壊します。元の単語と 3 つの壊れたバージョンを表示します。
c = @(x)x(:,sort([1:6 randi(6,1,2)]));

subplot(4,1,1,'XLim',[0 60])
spy(MATLAB)
xlabel('')
ylabel('Original')

for kj = 2:4
    subplot(4,1,kj,'XLim',[0 60])
    spy([c(M) c(A) c(T) c(L) c(A) c(B)])
    xlabel('')
    ylabel('Corrupted')
end
壊れたバージョンの単語をさらに 1 つ生成します。文字 "A" のノイズが含まれるバージョンを検索します。検索配列と、最も近いデータ セグメントの間の距離を表示します。横軸が厳格なため、セグメントは "T" まではみ出ます。
corr = [c(M) c(A) c(T) c(L) c(A) c(B)];

sgn = c(A);

[ist,ind,dst] = findsignal(corr,sgn);

clf
subplot(2,1,1)
spy(sgn)
subplot(2,1,2)
spy(corr)
chk = zeros(size(corr));
chk(:,ist:ind) = corr(:,ist:ind);
hold on
spy(chk,'*k')
hold off
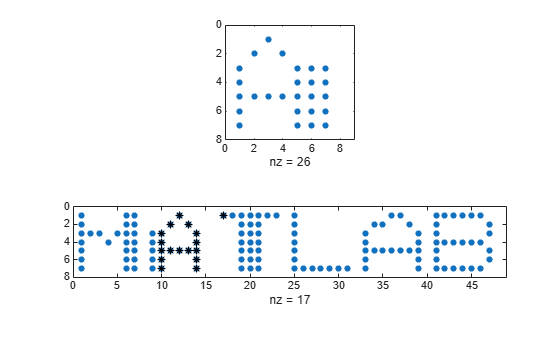
dst
dst = 11
横軸の引き伸ばしを許可します。最も近いセグメントは、検索配列と "A" の最初のインスタンスの交差部分です。セグメントと配列の間の距離は、0 となります。
[ist,ind,dst] = findsignal(corr,sgn,'TimeAlignment','dtw');

subplot(2,1,1)
spy(sgn)
subplot(2,1,2)
spy(corr)
chk = zeros(size(corr));
chk(:,ist:ind) = corr(:,ist:ind);
hold on
spy(chk,'*k')
hold off
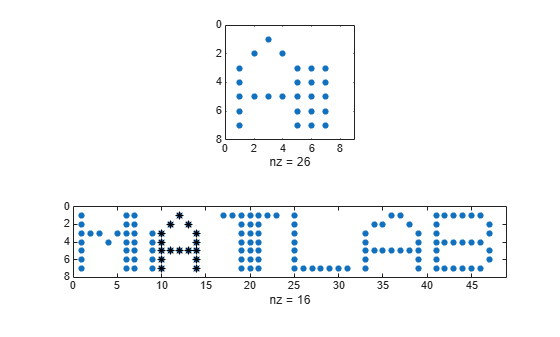
dst
dst = 0
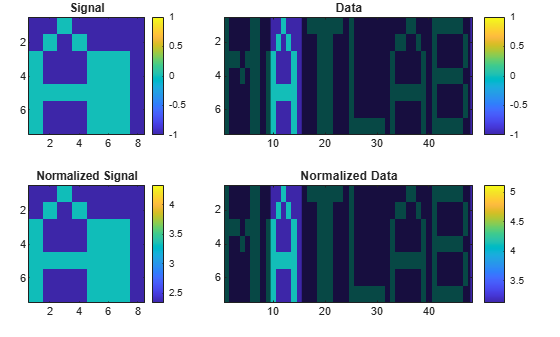
findsignal の組み込み機能を使用して計算を繰り返します。局所的な平均で除算し、データと信号を正規化します。対称カルバック・ライブラー距離を使用します。
findsignal(corr,sgn,'TimeAlignment','dtw', ...
    'Normalization','power','Metric','symmkl','Annotate','all')
入力引数
出力引数
拡張機能
バージョン履歴
R2016b で導入
You can also select a web site from the following list:
Americas
- América Latina (Español)
- Canada (English)
- United States (English)
Europe
- Belgium (English)
- Denmark (English)
- Deutschland (Deutsch)
- España (Español)
- Finland (English)
- France (Français)
- Ireland (English)
- Italia (Italiano)
- Luxembourg (English)
- Netherlands (English)
- Norway (English)
- Österreich (Deutsch)
- Portugal (English)
- Sweden (English)
- Switzerland
- United Kingdom (English)