このページの内容は最新ではありません。最新版の英語を参照するには、ここをクリックします。
plotregression
線形回帰のプロット
説明
例
回帰のプロット
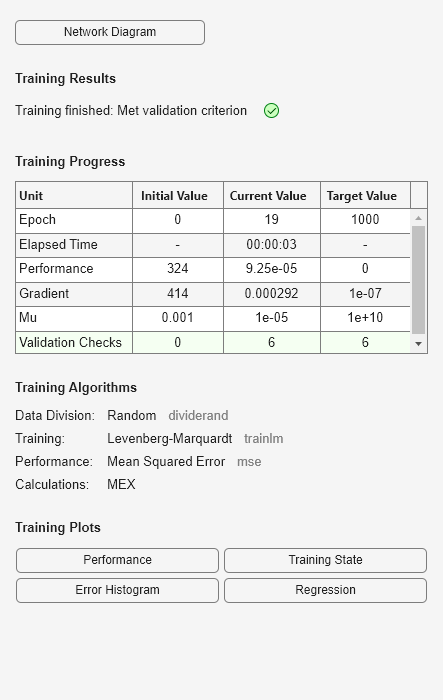
この例では、フィードフォワード ネットの線形回帰をプロットする方法を示します。
[x,t] = simplefit_dataset;
net = feedforwardnet(10);
net = train(net,x,t);
y = net(x);
plotregression(t,y,'Regression')
入力引数
バージョン履歴
R2008a で導入
You can also select a web site from the following list:
Americas
- América Latina (Español)
- Canada (English)
- United States (English)
Europe
- Belgium (English)
- Denmark (English)
- Deutschland (Deutsch)
- España (Español)
- Finland (English)
- France (Français)
- Ireland (English)
- Italia (Italiano)
- Luxembourg (English)
- Netherlands (English)
- Norway (English)
- Österreich (Deutsch)
- Portugal (English)
- Sweden (English)
- Switzerland
- United Kingdom (English)