subplot
タイル状に配置された Axes の作成
構文
説明
メモ
tiledlayout は、調整可能なタイルの間隔、Figure のサイズに応じてリフローするタイル、より適切に配置されたカラーバーと凡例を使用してレイアウトを作成できるため、subplot よりも推奨されます。 (R2019b 以降)
subplot( は現在の Figure を m,n,p)m 行 n 列のグリッドに分割し、p で指定された位置に座標軸を作成します。MATLAB® は行ごとにサブプロットの位置に番号を付けます。1 番目のサブプロットは 1 行目の 1 列目、2 番目のサブプロットは 1 行目の 2 列目となり、以下同様に続きます。指定した位置に座標軸がある場合、このコマンドはその座標軸を現在の座標軸にします。
subplot(___, は、1 つ以上の名前と値のペア引数を使用して、座標軸のプロパティを変更します。座標軸のプロパティは他のすべての入力引数の後に設定します。Name,Value)
例
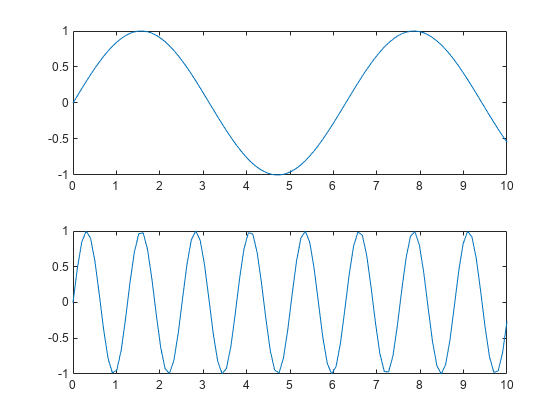
上下のサブプロット
2 つのサブプロットを積み上げた Figure を作成します。それぞれに正弦波をプロットします。
subplot(2,1,1);
x = linspace(0,10);
y1 = sin(x);
plot(x,y1)

subplot(2,1,2);
y2 = sin(5*x);
plot(x,y2)
サブプロットの象限
4 つのサブプロットに分かれた 1 つの Figure を作成します。それぞれに正弦波をプロットし、各サブプロットにタイトルを付けます。
subplot(2,2,1)
x = linspace(0,10);
y1 = sin(x);
plot(x,y1)
title('Subplot 1: sin(x)')

subplot(2,2,2)
y2 = sin(2*x);
plot(x,y2)
title('Subplot 2: sin(2x)')

subplot(2,2,3)
y3 = sin(4*x);
plot(x,y3)
title('Subplot 3: sin(4x)')

subplot(2,2,4)
y4 = sin(8*x);
plot(x,y4)
title('Subplot 4: sin(8x)')

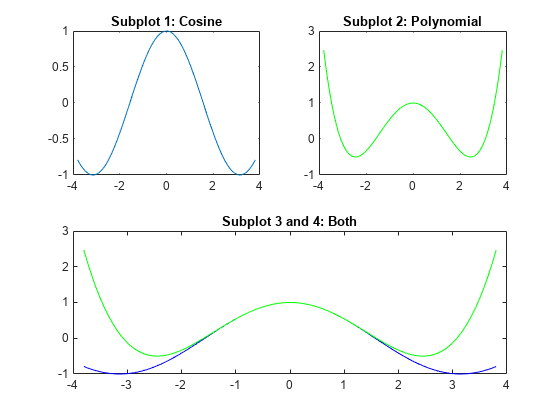
異なるサイズのサブプロット
3 つのサブプロットがある Figure を作成します。Figure の上半分を占めるサブプロットを 2 つ作成し、Figure の下半分を占める 3 番目のサブプロットを作成します。各サブプロットにタイトルを追加します。
subplot(2,2,1);
x = linspace(-3.8,3.8);
y_cos = cos(x);
plot(x,y_cos);
title('Subplot 1: Cosine')

subplot(2,2,2);
y_poly = 1 - x.^2./2 + x.^4./24;
plot(x,y_poly,'g');
title('Subplot 2: Polynomial')

subplot(2,2,[3,4]);
plot(x,y_cos,'b',x,y_poly,'g');
title('Subplot 3 and 4: Both')
サブプロットの空の座標軸での置き換え
乱数データのステム プロットを 4 つ含む Figure を作成します。2 番目のサブプロットを空の座標軸に置き換えます。
for k = 1:4
    data = rand(1,10);
    subplot(2,2,k)
    stem(data)
end
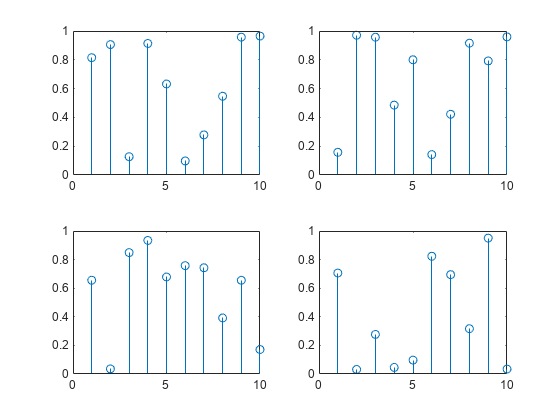
subplot(2,2,2,'replace')
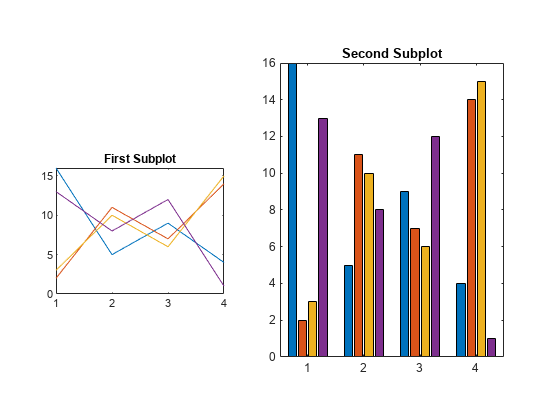
カスタム位置のサブプロット
グリッド位置に整列していない 2 つのサブプロットを含む Figure を作成します。サブプロットごとにカスタム位置を指定します。
pos1 = [0.1 0.3 0.3 0.3];
subplot('Position',pos1)
y = magic(4);
plot(y)
title('First Subplot')

pos2 = [0.5 0.15 0.4 0.7];
subplot('Position',pos2)
bar(y)
title('Second Subplot')
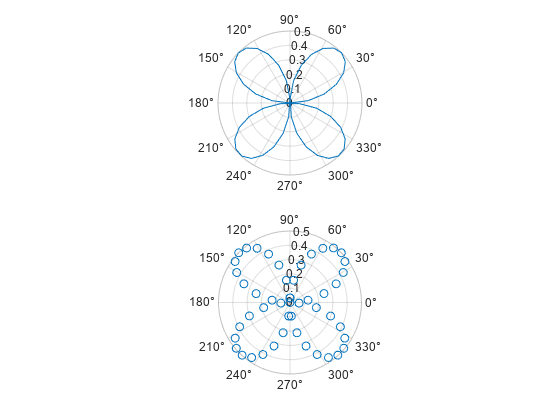
極座標軸をもつサブプロットの作成
2 つの極座標軸をもつ Figure を作成します。上のサブプロットに極座標の線グラフを作成し、下のサブプロットに極座標の散布図を作成します。
figure
ax1 = subplot(2,1,1,polaraxes);
theta = linspace(0,2*pi,50);
rho = sin(theta).*cos(theta);
polarplot(ax1,theta,rho)

ax2 = subplot(2,1,2,polaraxes);
polarscatter(ax2,theta,rho)
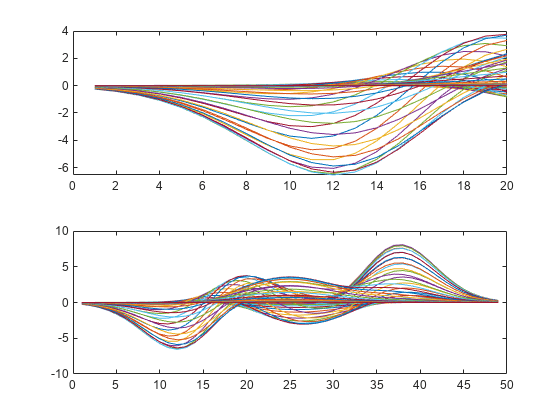
作成後の座標軸プロパティの変更
2 つのサブプロットを含む Figure を作成します。Axes オブジェクトを変数 ax1 および変数 ax2 に代入します。Axes オブジェクトをプロット関数の入力として指定し、関数が特定のサブプロットに必ずプロットされるようにします。
ax1 = subplot(2,1,1);
Z = peaks;
plot(ax1,Z(1:20,:))

ax2 = subplot(2,1,2);
plot(ax2,Z)
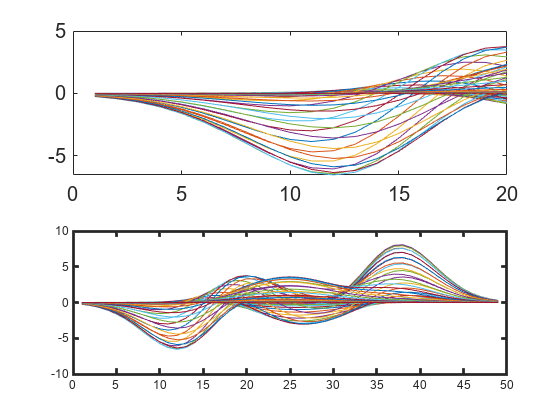
Axes オブジェクトのプロパティを設定して、座標軸を変更します。上のサブプロットのフォント サイズと、下のサブプロットの線幅を変更します。一部のプロット関数は、座標軸プロパティを設定します。既存の Axes プロパティの設定がオーバーライドされるのを防ぐために、プロット関数は Axes プロパティを指定する前に実行します。プロパティの設定にはドット表記を使用します。
ax1.FontSize = 15;
ax2.LineWidth = 2;
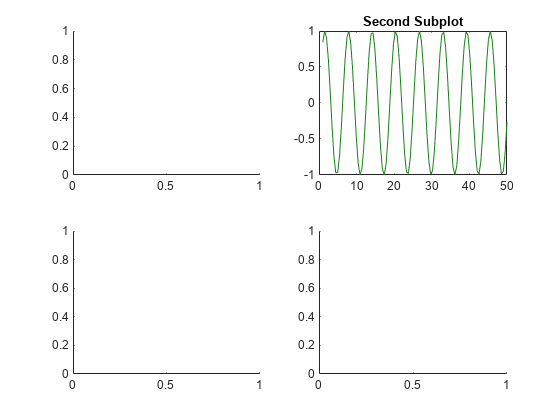
サブプロットを現在の座標軸に設定
複数のサブプロットを含む Figure を作成します。Axes オブジェクトをベクトル ax に保存します。次に、2 番目のサブプロットを現在の座標軸にします。線グラフを作成し、2 番目のサブプロットの軸の範囲を変更します。既定では、グラフィックス関数は現在の座標軸がその対象となります。
for k = 1:4
    ax(k) = subplot(2,2,k);
end

subplot(ax(2))
x = linspace(1,50);
y = sin(x);
plot(x,y,'Color',[0.1, 0.5, 0.1])
title('Second Subplot')
axis([0 50 -1 1])
既存の座標軸をサブプロットに変換
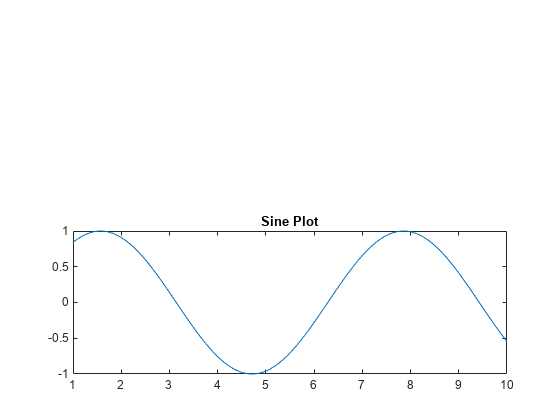
線グラフを作成します。次に、座標軸が Figure の下のサブプロットとなるように変換します。関数 subplot は、元の座標軸が存在していた Figure を使用します。
x = linspace(1,10);
y = sin(x);
plot(x,y)
title('Sine Plot')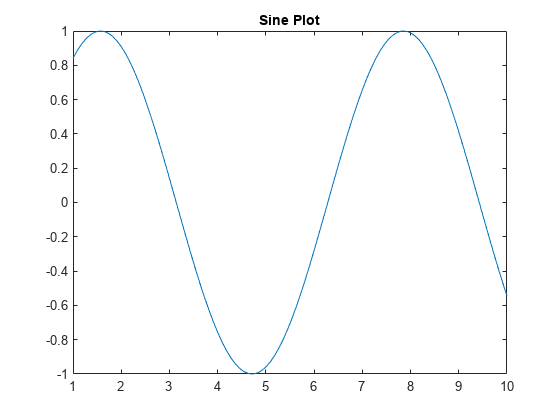
ax = gca;
subplot(2,1,2,ax)
別々の Figure の座標軸をサブプロットに変換
別々の Figure にある座標軸を組み合わせ、サブプロットをもつ単一の Figure にします。
2 つの異なる Figure に 2 つのプロットを作成します。Axes オブジェクトを変数 ax1 および変数 ax2 に代入します。Legend オブジェクトを変数 lgd に代入します。
figure
x = linspace(0,10);
y1 = sin(x);
plot(x,y1)
title('Line Plot 1')
ax1 = gca;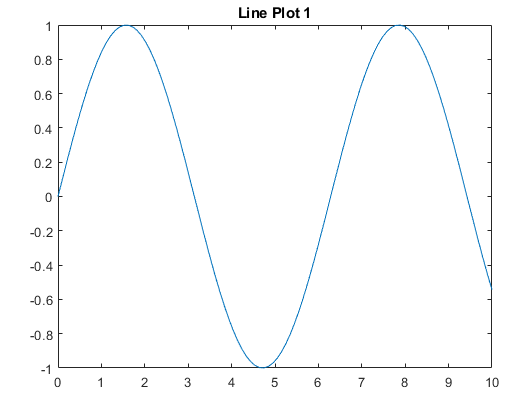
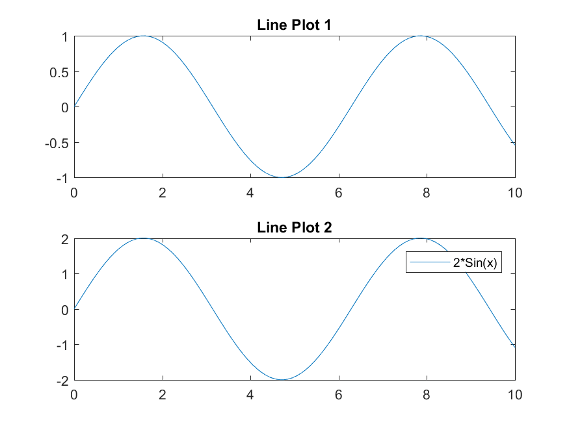
figure
y2 = 2*sin(x);
plot(x,y2)
title('Line Plot 2')
lgd = legend('2*Sin(x)');
ax2 = gca;

copyobj を使用して 2 つの Axes オブジェクトのコピーを作成します。コピーした座標軸の親を新しい Figure として指定します。凡例とカラーバーは、関連する座標軸と一緒にはコピーされないため、座標軸と共に凡例をコピーします。
fnew = figure;
ax1_copy = copyobj(ax1,fnew);
subplot(2,1,1,ax1_copy)

copies = copyobj([ax2,lgd],fnew);
ax2_copy = copies(1);
subplot(2,1,2,ax2_copy)
入力引数
ヒント
Figure の内容をクリアするには、
clfを使用します。たとえば、新しいサブプロット レイアウトを作成する前に、Figure から既存のサブプロット レイアウトをクリアできます。座標軸を重ねるには、代わりに
axesコマンドを使用します。関数subplotは、新しい座標軸とオーバーラップしている既存の座標軸を削除します。たとえば、subplot('Position',[.35 .35 .3 .3])は基となる座標軸をすべて削除しますが、axes('Position',[.35 .35 .3 .3])は基となる座標軸を削除せずに、Figure の中央に新しい座標軸を配置します。subplot(111)は例外で、subplot(1,1,1)とは動作が同一ではありません。subplot(111)は下位互換性を確保するための特殊なサブプロットで、すぐには座標軸を作成せず、次のグラフィックス コマンドがclf resetを実行するように Figure を設定します。次のグラフィックス コマンドは Figure の子をすべて削除し、既定の位置に新しい座標軸を作成します。subplot(111)はAxesオブジェクトを返さず、コードで戻り引数を指定するとエラーが発生します。
代替機能
設定可能なプロットのタイル配置を作成するには、関数 tiledlayout と関数 nexttile を使用します。次を含む設定オプションがあります。
プロット間およびレイアウトの縁周辺の間隔の制御
レイアウトの上部に共有タイトルを表示するためのオプション
x 軸と y 軸の共有ラベルを使用するためのオプション
タイル配置を固定サイズとするかリフロー可能な可変サイズとするかを制御するオプション
詳細については、複数のプロットの結合を参照してください。
バージョン履歴
R2006a より前に導入
参考
関数
プロパティ
トピック
You can also select a web site from the following list:
Americas
- América Latina (Español)
- Canada (English)
- United States (English)
Europe
- Belgium (English)
- Denmark (English)
- Deutschland (Deutsch)
- España (Español)
- Finland (English)
- France (Français)
- Ireland (English)
- Italia (Italiano)
- Luxembourg (English)
- Netherlands (English)
- Norway (English)
- Österreich (Deutsch)
- Portugal (English)
- Sweden (English)
- Switzerland
- United Kingdom (English)